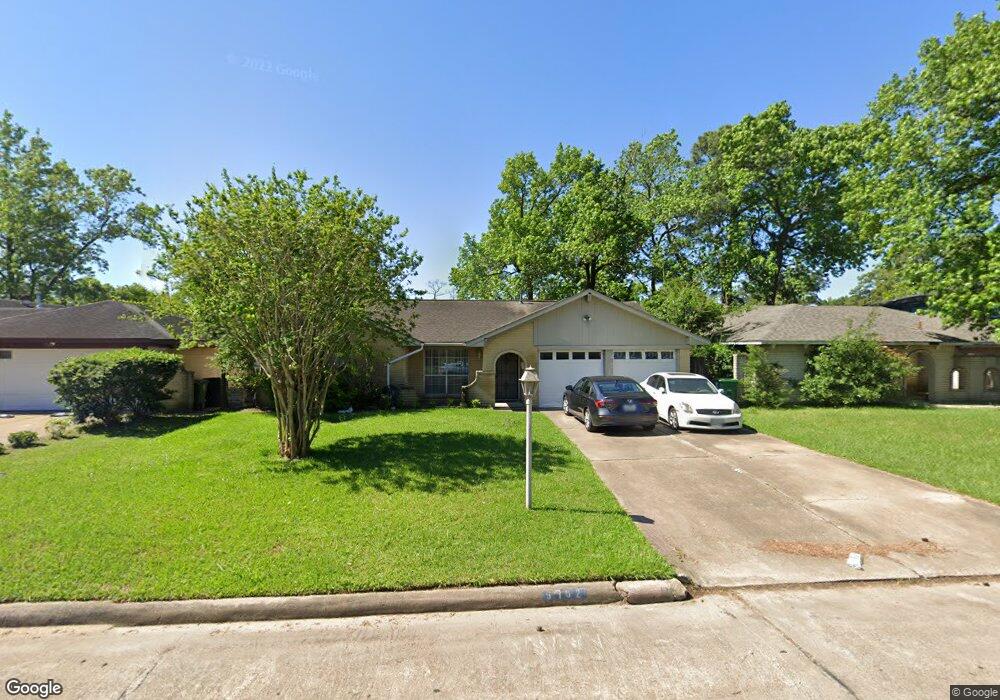
5702 Yorkwood St Houston, TX 77016
East Little York NeighborhoodEstimated Value: $188,000 - $244,000
3
Beds
2
Baths
1,352
Sq Ft
$155/Sq Ft
Est. Value
About This Home
This home is located at 5702 Yorkwood St, Houston, TX 77016 and is currently estimated at $209,605, approximately $155 per square foot. 5702 Yorkwood St is a home located in Harris County with nearby schools including Shadydale Elementary School, Forest Brook Middle, and North Forest High School.
Ownership History
Date
Name
Owned For
Owner Type
Purchase Details
Closed on
Aug 15, 2019
Sold by
Haro Alejandro
Bought by
Pineda Ruben
Current Estimated Value
Purchase Details
Closed on
Oct 16, 2015
Sold by
Perez Rigo A Arellano and Delgadillo Nancy
Bought by
Haro Alejandro
Purchase Details
Closed on
Jul 21, 2011
Sold by
Pineda Salvador and Sanchez Ofelia Cardenas
Bought by
Perez Rigo A Arellano and Delgadillo Nancy
Purchase Details
Closed on
Jun 24, 2008
Sold by
Steen Dorothy Nell and Steen Valarie Yvonne
Bought by
Pineda Salvador
Purchase Details
Closed on
Feb 7, 2006
Sold by
Steen Dorothy Nell
Bought by
Steen Dorothy Nell and Steen Valarie Yvonne
Home Financials for this Owner
Home Financials are based on the most recent Mortgage that was taken out on this home.
Original Mortgage
$68,000
Interest Rate
6.15%
Mortgage Type
New Conventional
Create a Home Valuation Report for This Property
The Home Valuation Report is an in-depth analysis detailing your home's value as well as a comparison with similar homes in the area
Home Values in the Area
Average Home Value in this Area
Purchase History
| Date | Buyer | Sale Price | Title Company |
|---|---|---|---|
| Pineda Ruben | -- | None Available | |
| Haro Alejandro | -- | Stewart Title | |
| Perez Rigo A Arellano | -- | None Available | |
| Pineda Salvador | -- | None Available | |
| Steen Dorothy Nell | -- | Netco |
Source: Public Records
Mortgage History
| Date | Status | Borrower | Loan Amount |
|---|---|---|---|
| Previous Owner | Steen Dorothy Nell | $68,000 |
Source: Public Records
Tax History Compared to Growth
Tax History
| Year | Tax Paid | Tax Assessment Tax Assessment Total Assessment is a certain percentage of the fair market value that is determined by local assessors to be the total taxable value of land and additions on the property. | Land | Improvement |
|---|---|---|---|---|
| 2025 | $3,998 | $193,524 | $52,266 | $141,258 |
| 2024 | $3,998 | $191,067 | $43,836 | $147,231 |
| 2023 | $3,998 | $183,445 | $43,836 | $139,609 |
| 2022 | $3,217 | $146,103 | $33,720 | $112,383 |
| 2021 | $2,582 | $110,769 | $18,546 | $92,223 |
| 2020 | $2,347 | $96,932 | $18,546 | $78,386 |
| 2019 | $2,071 | $81,832 | $14,162 | $67,670 |
| 2018 | $1,668 | $65,936 | $13,488 | $52,448 |
| 2017 | $1,667 | $65,936 | $13,488 | $52,448 |
| 2016 | $1,597 | $63,171 | $13,488 | $49,683 |
| 2015 | $1,524 | $59,286 | $13,488 | $45,798 |
| 2014 | $1,524 | $59,286 | $13,488 | $45,798 |
Source: Public Records
Map
Nearby Homes
- 5611 Yorkwood St
- 10606 Bucknell Rd
- 5618 Briarwick Ln
- 5905 Langley Rd
- 10535 Hollyglen Dr
- 10821 Seneca St
- 10526 Hollyglen Dr
- 10434 Envoy St
- 10538 Royal Oaks Dr
- 0 Cedar Hill Ln Unit 45497108
- 10430 Royal Oaks Dr
- 5123 Francine Ln
- 5130 Farb Dr
- 10507 Vinca Minor Ln
- 5815 Mohawk St
- 5022 Bretshire Dr
- 0 Hopper Rd Unit 35613143
- 5833 Mohawk St
- 10221 Bretton Dr
- 10317 Kelburn Dr
- 5706 Yorkwood St
- 5614 Yorkwood St
- 5710 Yorkwood St
- 5610 Yorkwood St
- 5703 Knightwood St
- 5615 Knightwood St
- 0 Yorkwood Unit 69740464
- 5707 Knightwood St
- 5611 Knightwood St
- 5802 Yorkwood St
- 5606 Yorkwood St
- 5703 Yorkwood St
- 5707 Yorkwood St
- 5711 Knightwood St
- 5607 Knightwood St
- 5607 Yorkwood St
- 5806 Yorkwood St
- 5715 Knightwood St
- 5602 Yorkwood St
- 5803 Yorkwood St