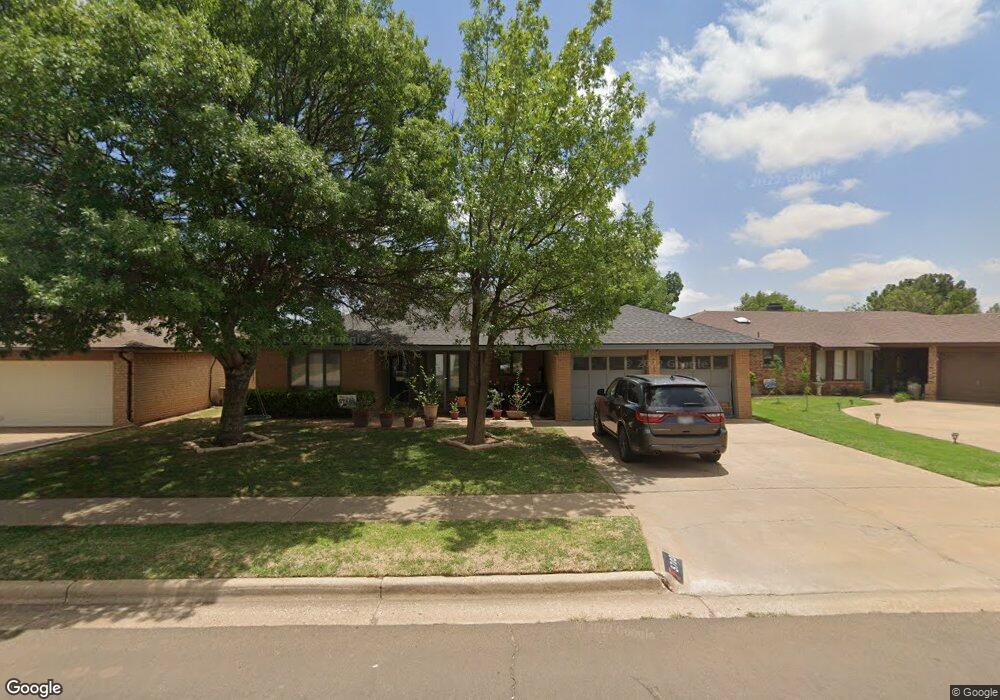
5703 91st St Lubbock, TX 79424
Preston Smith NeighborhoodEstimated Value: $236,000 - $251,125
3
Beds
2
Baths
1,753
Sq Ft
$140/Sq Ft
Est. Value
About This Home
This home is located at 5703 91st St, Lubbock, TX 79424 and is currently estimated at $244,781, approximately $139 per square foot. 5703 91st St is a home located in Lubbock County with nearby schools including Smith Elementary School, Irons Middle School, and Coronado High School.
Ownership History
Date
Name
Owned For
Owner Type
Purchase Details
Closed on
May 10, 2019
Sold by
Hall Brittany Lynn and Hall Gabriel
Bought by
Hall Brittany Lynn
Current Estimated Value
Home Financials for this Owner
Home Financials are based on the most recent Mortgage that was taken out on this home.
Original Mortgage
$124,000
Outstanding Balance
$80,500
Interest Rate
4%
Mortgage Type
Stand Alone First
Estimated Equity
$164,281
Purchase Details
Closed on
Aug 31, 2009
Sold by
Mccord Billie
Bought by
Dendle Brittany Lynn
Home Financials for this Owner
Home Financials are based on the most recent Mortgage that was taken out on this home.
Original Mortgage
$102,973
Interest Rate
5.16%
Mortgage Type
FHA
Purchase Details
Closed on
Jan 6, 2009
Sold by
Mccord Mack and Mccord Billie
Bought by
Dendle Brittany Lynn
Create a Home Valuation Report for This Property
The Home Valuation Report is an in-depth analysis detailing your home's value as well as a comparison with similar homes in the area
Home Values in the Area
Average Home Value in this Area
Purchase History
| Date | Buyer | Sale Price | Title Company |
|---|---|---|---|
| Hall Brittany Lynn | -- | None Available | |
| Dendle Brittany Lynn | -- | Western Title Company | |
| Dendle Brittany Lynn | -- | -- |
Source: Public Records
Mortgage History
| Date | Status | Borrower | Loan Amount |
|---|---|---|---|
| Open | Hall Brittany Lynn | $124,000 | |
| Closed | Dendle Brittany Lynn | $102,973 |
Source: Public Records
Tax History
| Year | Tax Paid | Tax Assessment Tax Assessment Total Assessment is a certain percentage of the fair market value that is determined by local assessors to be the total taxable value of land and additions on the property. | Land | Improvement |
|---|---|---|---|---|
| 2025 | $3,364 | $254,896 | $18,525 | $236,371 |
| 2024 | $43 | $244,258 | $18,525 | $225,733 |
| 2023 | $3,976 | $213,905 | $18,525 | $195,380 |
| 2022 | $3,936 | $194,459 | $18,525 | $195,005 |
| 2021 | $3,786 | $176,781 | $18,525 | $158,256 |
| 2020 | $3,732 | $171,643 | $18,525 | $153,118 |
| 2019 | $3,853 | $171,643 | $18,525 | $153,118 |
| 2018 | $3,512 | $156,229 | $18,525 | $137,704 |
| 2017 | $3,516 | $156,229 | $18,525 | $137,704 |
| 2016 | $3,268 | $145,184 | $18,525 | $126,659 |
| 2015 | $2,639 | $134,014 | $9,750 | $124,264 |
| 2014 | $2,639 | $127,024 | $9,750 | $117,274 |
Source: Public Records
Map
Nearby Homes
Your Personal Tour Guide
Ask me questions while you tour the home.