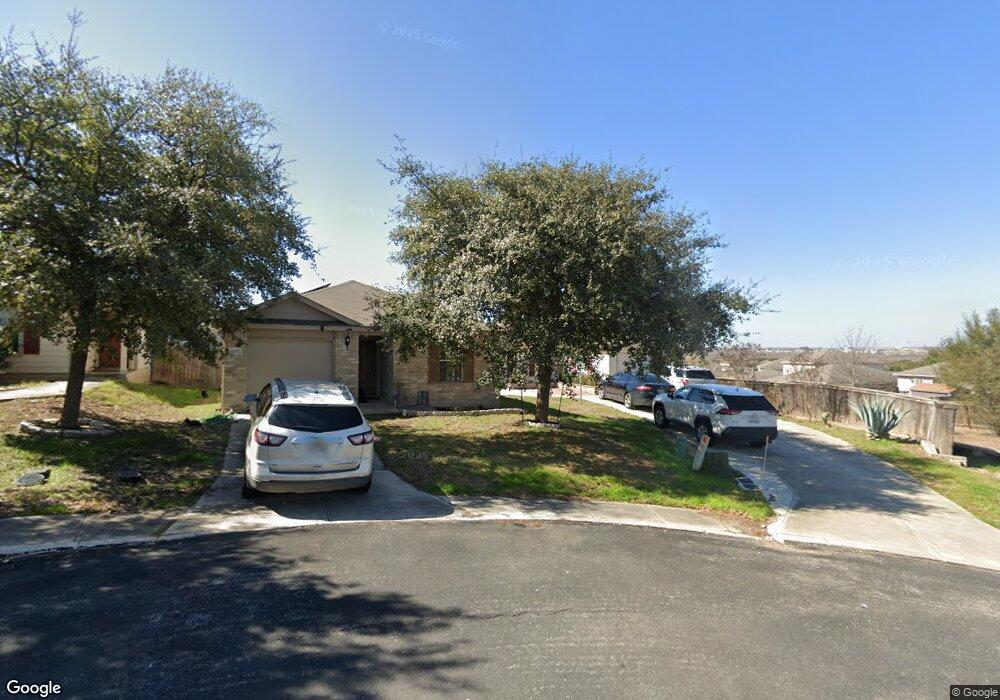
5703 Hickory Canyon Unit 5 San Antonio, TX 78252
Southwest San Antonio NeighborhoodEstimated Value: $154,061 - $186,000
2
Beds
1
Bath
851
Sq Ft
$203/Sq Ft
Est. Value
About This Home
This home is located at 5703 Hickory Canyon Unit 5, San Antonio, TX 78252 and is currently estimated at $172,765, approximately $203 per square foot. 5703 Hickory Canyon Unit 5 is a home located in Bexar County with nearby schools including Southwest Elementary School, Ronald E Mcnair Middle School, and Southwest High School.
Ownership History
Date
Name
Owned For
Owner Type
Purchase Details
Closed on
Jan 11, 2012
Sold by
The Secretary Of Housing & Urban Develop
Bought by
Molina Juvenal R
Current Estimated Value
Home Financials for this Owner
Home Financials are based on the most recent Mortgage that was taken out on this home.
Original Mortgage
$50,843
Outstanding Balance
$35,500
Interest Rate
4.37%
Mortgage Type
FHA
Estimated Equity
$137,265
Purchase Details
Closed on
Oct 10, 2011
Sold by
Citimortgage Inc
Bought by
Secretary Of Housing & Urban Development
Purchase Details
Closed on
Oct 4, 2011
Sold by
Penrod Ricky and Penrod Analyn
Bought by
Citimortgage Inc
Purchase Details
Closed on
Aug 21, 2008
Sold by
Lgi Homes Canyon Crossing Ltd
Bought by
Penrod Ricky and Penrod Analyn
Home Financials for this Owner
Home Financials are based on the most recent Mortgage that was taken out on this home.
Original Mortgage
$101,648
Interest Rate
6.66%
Mortgage Type
Purchase Money Mortgage
Create a Home Valuation Report for This Property
The Home Valuation Report is an in-depth analysis detailing your home's value as well as a comparison with similar homes in the area
Home Values in the Area
Average Home Value in this Area
Purchase History
| Date | Buyer | Sale Price | Title Company |
|---|---|---|---|
| Molina Juvenal R | -- | None Available | |
| Secretary Of Housing & Urban Development | -- | None Available | |
| Citimortgage Inc | $115,407 | None Available | |
| Citimortgage Inc | $62,248 | None Available | |
| Penrod Ricky | -- | None Available |
Source: Public Records
Mortgage History
| Date | Status | Borrower | Loan Amount |
|---|---|---|---|
| Open | Molina Juvenal R | $50,843 | |
| Previous Owner | Penrod Ricky | $101,648 |
Source: Public Records
Tax History Compared to Growth
Tax History
| Year | Tax Paid | Tax Assessment Tax Assessment Total Assessment is a certain percentage of the fair market value that is determined by local assessors to be the total taxable value of land and additions on the property. | Land | Improvement |
|---|---|---|---|---|
| 2025 | $2,033 | $162,950 | $58,360 | $104,590 |
| 2024 | $2,033 | $168,971 | $58,360 | $111,710 |
| 2023 | $2,033 | $153,610 | $58,360 | $118,960 |
| 2022 | $3,046 | $139,645 | $42,460 | $124,650 |
| 2021 | $2,816 | $126,950 | $40,100 | $86,850 |
| 2020 | $2,725 | $117,550 | $32,080 | $85,470 |
| 2019 | $2,561 | $110,500 | $32,080 | $78,420 |
| 2018 | $2,377 | $102,470 | $25,350 | $77,120 |
| 2017 | $2,256 | $97,070 | $21,900 | $75,170 |
| 2016 | $2,091 | $89,960 | $21,900 | $68,060 |
| 2015 | $1,163 | $76,920 | $15,000 | $61,920 |
| 2014 | $1,163 | $49,510 | $0 | $0 |
Source: Public Records
Map
Nearby Homes
- 5874 Wildcat Canyon
- 11266 Magic Canyon
- 11402 Indian Canyon Unit 4
- 5714 Fossil Canyon
- 5526 Bat Canyon
- 11438 Country Canyon
- 11351 Fire Canyon
- 11354 Fire Canyon
- 11455 Country Canyon
- 11411 Coral Canyon
- 11419 Coral Canyon
- 11110 Indian Canyon
- 11458 Coral Canyon
- 5742 Butch Canyon
- 11022 Bluff Canyon
- 11526 Country Canyon
- 5634 Forest Canyon
- 10926 Acorn Canyon
- 5422 Blossom Canyon
- 11222 Begonia Rock
- 5707 Hickory Canyon
- 5834 Wildcat Canyon
- 5711 Hickory Canyon
- 5830 Wildcat Canyon
- 5838 Wildcat Canyon
- 5715 Hickory Canyon
- 5719 Hickory Canyon
- 5842 Wildcat Canyon
- 11214 Magic Canyon
- 11210 Magic Canyon
- 5706 Hickory Canyon
- 11218 Magic Canyon
- 5846 Wildcat Canyon
- 5714 Hickory Canyon
- 11222 Magic Canyon
- 5718 Hickory Canyon
- 11206 Magic Canyon
- 5826 Wildcat Canyon
- 5723 Hickory Canyon
- 5702 Hickory Canyon