
Seller's Agent in 2025
Lee Arnold
Keller Williams Spokane - Main
(800) 341-9918
6 in this area
220 Total Sales

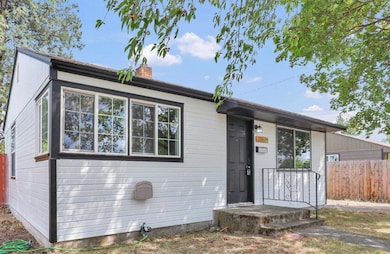
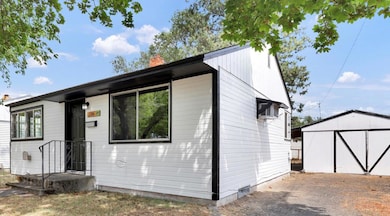
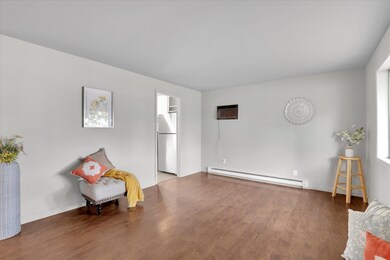
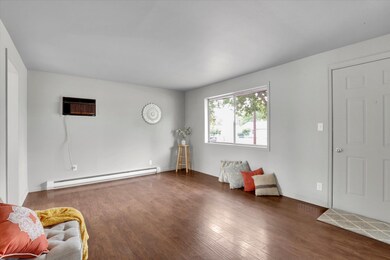
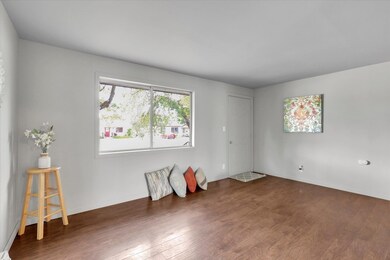
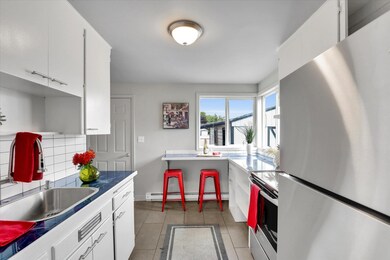
Charming North Spokane home! This 2BD/1BA features stylish LVP flooring, fresh interior paint, accent walls, and a sliding barn door that adds a touch of character. The light-filled living room flows into a kitchen with cool, modern vibes and ample cabinet space. Outside, enjoy new exterior paint, a fully fenced yard with mature landscaping, a covered patio for relaxing or entertaining, a detached 1-car garage, and an absolutely adorable shed—perfect for gardening or a private retreat. Located on a quiet street near parks, schools, shopping, and bus routes. Clean, updated, and move-in ready!
Last Agent to Sell the Property
Keller Williams Spokane - Main Brokerage Phone: (801) 574-4020 License #25890 Listed on: 07/11/2025
| Date | Type | Sale Price | Title Company |
|---|---|---|---|
| Warranty Deed | $250,000 | First American Title | |
| Warranty Deed | $170,000 | First American Title | |
| Warranty Deed | $74,000 | Pacific Nw Title | |
| Trustee Deed | $63,000 | -- | |
| Warranty Deed | $55,100 | First American Title Ins |
| Date | Status | Loan Amount | Loan Type |
|---|---|---|---|
| Open | $175,000 | New Conventional | |
| Previous Owner | $74,000 | Fannie Mae Freddie Mac | |
| Previous Owner | $53,447 | No Value Available |
| Date | Event | Price | List to Sale | Price per Sq Ft |
|---|---|---|---|---|
| 09/09/2025 09/09/25 | Sold | $250,000 | -3.8% | $372 / Sq Ft |
| 08/15/2025 08/15/25 | Pending | -- | -- | -- |
| 08/12/2025 08/12/25 | Price Changed | $259,897 | 0.0% | $387 / Sq Ft |
| 07/22/2025 07/22/25 | Price Changed | $259,898 | 0.0% | $387 / Sq Ft |
| 07/16/2025 07/16/25 | Price Changed | $259,899 | 0.0% | $387 / Sq Ft |
| 07/11/2025 07/11/25 | For Sale | $259,900 | -- | $387 / Sq Ft |
| Year | Tax Paid | Tax Assessment Tax Assessment Total Assessment is a certain percentage of the fair market value that is determined by local assessors to be the total taxable value of land and additions on the property. | Land | Improvement |
|---|---|---|---|---|
| 2025 | $2,223 | $224,800 | $80,000 | $144,800 |
| 2024 | $2,223 | $223,500 | $75,000 | $148,500 |
| 2023 | $2,056 | $215,300 | $70,000 | $145,300 |
| 2022 | $1,994 | $209,600 | $70,000 | $139,600 |
| 2021 | $1,605 | $134,400 | $36,000 | $98,400 |
| 2020 | $1,451 | $117,000 | $32,000 | $85,000 |
| 2019 | $1,266 | $105,600 | $29,500 | $76,100 |
| 2018 | $1,320 | $94,600 | $23,500 | $71,100 |
| 2017 | $1,135 | $82,800 | $23,500 | $59,300 |
| 2016 | $1,049 | $74,800 | $23,500 | $51,300 |
| 2015 | $1,072 | $74,800 | $23,500 | $51,300 |
| 2014 | -- | $73,800 | $23,500 | $50,300 |
| 2013 | -- | $0 | $0 | $0 |
Seller's Agent in 2025
Lee Arnold
Keller Williams Spokane - Main
(800) 341-9918
6 in this area
220 Total Sales
Seller Co-Listing Agent in 2025
Michelle Eyraud-Mendez
Cogo Realty
(208) 620-9171
4 in this area
169 Total Sales
Buyer's Agent in 2025
Jody Lee
REAL Broker LLC
(509) 389-1798
5 in this area
108 Total Sales
Source: Spokane Association of REALTORS®
MLS Number: 202520406
APN: 26362.1431
Disclaimer: Certain information contained herein is derived from information provided by parties other than Homes.com. All information provided is deemed reliable, but is not guaranteed to be accurate and should be independently verified.
![]() IDX information is provided exclusively for personal, non-commercial use, and may not be used for any purpose other than to identify prospective properties consumers may be interested in purchasing.
IDX information is provided exclusively for personal, non-commercial use, and may not be used for any purpose other than to identify prospective properties consumers may be interested in purchasing.
Information is deemed reliable but not guaranteed.