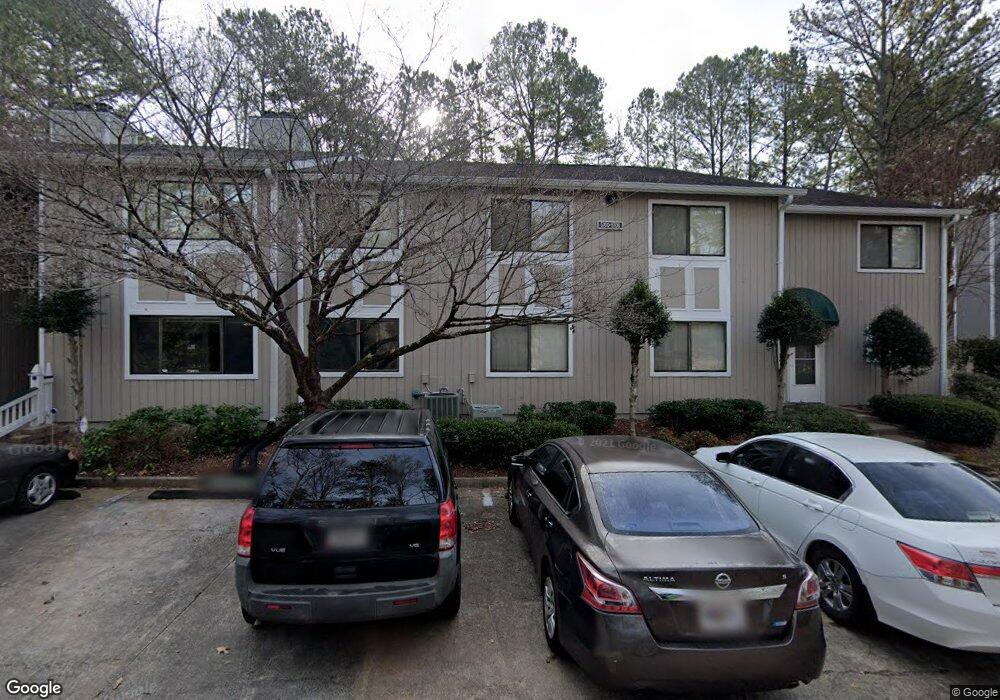
5704 Woodmont Blvd Unit 5704 Norcross, GA 30092
Estimated Value: $209,000 - $227,000
2
Beds
2
Baths
1,278
Sq Ft
$169/Sq Ft
Est. Value
About This Home
This home is located at 5704 Woodmont Blvd Unit 5704, Norcross, GA 30092 and is currently estimated at $216,595, approximately $169 per square foot. 5704 Woodmont Blvd Unit 5704 is a home located in Gwinnett County with nearby schools including Peachtree Elementary School, Pinckneyville Middle School, and Paul Duke STEM High School.
Ownership History
Date
Name
Owned For
Owner Type
Purchase Details
Closed on
Sep 28, 2001
Sold by
Bordwin James A and Bordwin Connie
Bought by
Baggett Sharon E
Current Estimated Value
Home Financials for this Owner
Home Financials are based on the most recent Mortgage that was taken out on this home.
Original Mortgage
$91,650
Outstanding Balance
$35,079
Interest Rate
6.89%
Mortgage Type
New Conventional
Estimated Equity
$181,516
Purchase Details
Closed on
Oct 26, 2000
Sold by
Coleman Matthew J
Bought by
Borduin James A and Borduin Connie
Home Financials for this Owner
Home Financials are based on the most recent Mortgage that was taken out on this home.
Original Mortgage
$51,500
Interest Rate
7.93%
Mortgage Type
New Conventional
Purchase Details
Closed on
Mar 26, 1996
Sold by
Cochran Donna
Bought by
Coleman Matthew
Create a Home Valuation Report for This Property
The Home Valuation Report is an in-depth analysis detailing your home's value as well as a comparison with similar homes in the area
Home Values in the Area
Average Home Value in this Area
Purchase History
| Date | Buyer | Sale Price | Title Company |
|---|---|---|---|
| Baggett Sharon E | $94,500 | -- | |
| Borduin James A | $81,500 | -- | |
| Coleman Matthew | $66,300 | -- |
Source: Public Records
Mortgage History
| Date | Status | Borrower | Loan Amount |
|---|---|---|---|
| Open | Baggett Sharon E | $91,650 | |
| Previous Owner | Borduin James A | $51,500 | |
| Closed | Coleman Matthew | $0 |
Source: Public Records
Tax History Compared to Growth
Tax History
| Year | Tax Paid | Tax Assessment Tax Assessment Total Assessment is a certain percentage of the fair market value that is determined by local assessors to be the total taxable value of land and additions on the property. | Land | Improvement |
|---|---|---|---|---|
| 2025 | $376 | $90,800 | $26,120 | $64,680 |
| 2024 | $376 | $85,320 | $11,800 | $73,520 |
| 2023 | $376 | $79,920 | $11,800 | $68,120 |
| 2022 | $376 | $70,640 | $11,800 | $58,840 |
| 2021 | $376 | $54,520 | $10,000 | $44,520 |
| 2020 | $376 | $51,480 | $7,640 | $43,840 |
| 2019 | $344 | $44,800 | $6,000 | $38,800 |
| 2018 | $344 | $36,320 | $4,400 | $31,920 |
| 2016 | $793 | $27,560 | $4,400 | $23,160 |
| 2015 | $533 | $19,920 | $2,800 | $17,120 |
| 2014 | -- | $19,920 | $2,800 | $17,120 |
Source: Public Records
Map
Nearby Homes
- 5708 Woodmont Blvd
- 6220 Brookwood Rd
- 3561 Views Trace
- 6300 Woodmont Blvd Unit 6300
- 6119 Woodmont Blvd Unit 6119
- 6188 Brookwood Rd
- 6244 Overlook Rd
- 6240 Overlook Rd
- 3557 Splinterwood Rd
- 3569 Splinterwood Rd
- 6170 Woodland Rd
- 3165 Woodland Rd
- 6509 Woodmont Blvd
- 6373 Hawthorne Terrace
- 6363 Brandywine Trail
- 6295 Windsor Trace Dr
- 6315 Windsor Trace Dr
- 3479 Kiveton Dr
- 6089 Tennyson Park Way
- 4944 Sealy Cir
- 5702 Woodmont Blvd Unit 5702
- 5706 Woodmont Blvd
- 5700 Woodmont Blvd
- 5710 Woodmont Blvd
- 5712 Woodmont Blvd Unit 5712
- 5714 Woodmont Blvd Unit 5714
- 5618 Woodmont Blvd
- 5716 Woodmont Blvd
- 5718 Woodmont Blvd
- 5718 Woodmont Blvd Unit 5718
- 5610 Woodmont Blvd
- 5614 Woodmont Blvd
- 5614 Woodmont Blvd Unit 5614
- 5612 Woodmont Blvd Unit 5612
- 5616 Woodmont Blvd
- 5604 Woodmont Blvd
- 5602 Woodmont Blvd Unit 5602
- 5606 Woodmont Blvd Unit 5606
- 5606 Woodmont Blvd
- 5606 Woodmont Blvd