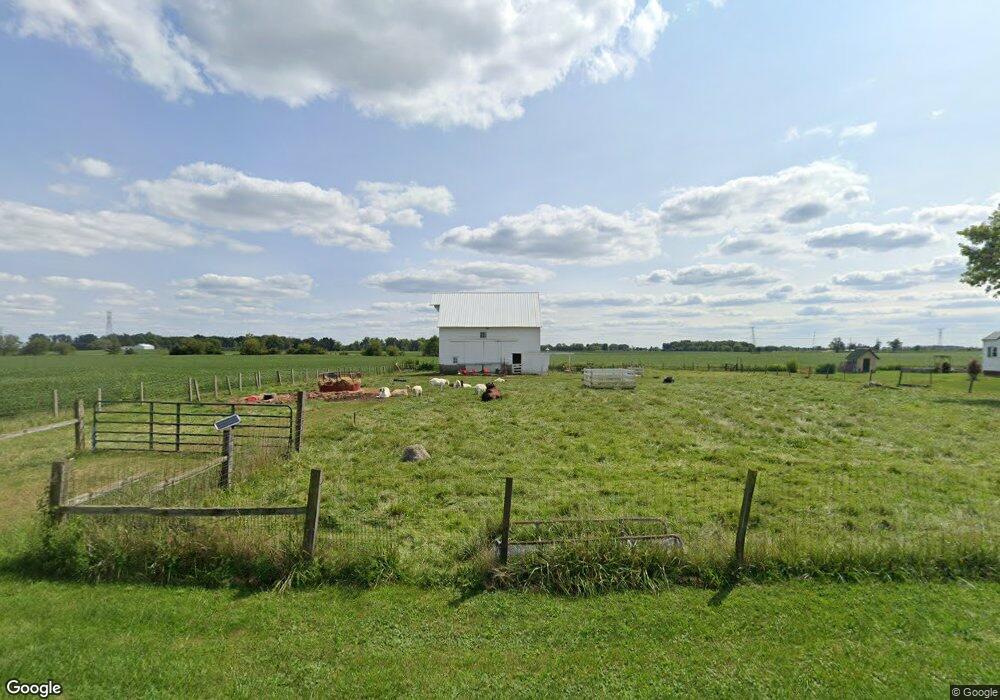
5705 E 400 N Greenfield, IN 46140
Estimated Value: $263,000 - $313,000
2
Beds
1
Bath
2,232
Sq Ft
$128/Sq Ft
Est. Value
About This Home
This home is located at 5705 E 400 N, Greenfield, IN 46140 and is currently estimated at $285,525, approximately $127 per square foot. 5705 E 400 N is a home located in Hancock County with nearby schools including Eastern Hancock Elementary School, Eastern Hancock Middle School, and Eastern Hancock High School.
Ownership History
Date
Name
Owned For
Owner Type
Purchase Details
Closed on
Sep 27, 2021
Sold by
Vickrey Stephanie K and Lutz Kendra L
Bought by
Vickrey Stephanie K
Current Estimated Value
Purchase Details
Closed on
Jun 8, 2010
Sold by
Knose Ronald J and Knose Vickie L
Bought by
Lutz Kendra L and Vickrey Stephanie K
Home Financials for this Owner
Home Financials are based on the most recent Mortgage that was taken out on this home.
Original Mortgage
$124,699
Interest Rate
5.25%
Mortgage Type
FHA
Purchase Details
Closed on
Jul 28, 2008
Sold by
Citimortgage Inc
Bought by
Knose Ronald J and Knose Vickie L
Purchase Details
Closed on
Jun 19, 2008
Sold by
Phifer Jeffrey D and Phifer Jeffrey
Bought by
Citimortgage Inc
Create a Home Valuation Report for This Property
The Home Valuation Report is an in-depth analysis detailing your home's value as well as a comparison with similar homes in the area
Purchase History
| Date | Buyer | Sale Price | Title Company |
|---|---|---|---|
| Vickrey Stephanie K | $29,400 | None Available | |
| Lutz Kendra L | -- | -- | |
| Knose Ronald J | -- | -- | |
| Citimortgage Inc | $63,200 | -- |
Source: Public Records
Mortgage History
| Date | Status | Borrower | Loan Amount |
|---|---|---|---|
| Previous Owner | Lutz Kendra L | $124,699 |
Source: Public Records
Tax History
| Year | Tax Paid | Tax Assessment Tax Assessment Total Assessment is a certain percentage of the fair market value that is determined by local assessors to be the total taxable value of land and additions on the property. | Land | Improvement |
|---|---|---|---|---|
| 2025 | $1,485 | $273,400 | $73,100 | $200,300 |
| 2024 | $1,485 | $264,400 | $73,100 | $191,300 |
| 2023 | $1,485 | $254,700 | $73,100 | $181,600 |
| 2022 | $924 | $190,000 | $35,100 | $154,900 |
| 2021 | $808 | $143,100 | $35,100 | $108,000 |
| 2020 | $813 | $139,600 | $35,100 | $104,500 |
| 2019 | $743 | $134,300 | $35,100 | $99,200 |
| 2018 | $737 | $134,300 | $35,100 | $99,200 |
| 2017 | $809 | $136,100 | $35,100 | $101,000 |
| 2016 | $762 | $134,800 | $34,000 | $100,800 |
| 2014 | $711 | $126,800 | $32,900 | $93,900 |
| 2013 | $711 | $123,800 | $32,900 | $90,900 |
Source: Public Records
Map
Nearby Homes
- 1380 Fairmount Dr
- 3513 N 300 E
- 1751 Moss Landing Ln
- 1643 Colorado Spruce Way
- 1631 Colorado Spruce Way
- 1616 Colorado Spruce Way
- 2415 Fir Dr
- 2403 Fir Dr
- 2345 Fir Dr
- 2065 Frost Line Ln
- 1624 Hemlock Cir
- 2331 Fir Dr
- 2053 Frost Line Ln
- 2420 Fir Dr
- 2412 Fir Dr
- 2220 Foothill Dr
- 2021 Frost Line Ln
- 2054 Frost Line Ln
- 5426 N 300 E
- 1633 Clover Crossing Dr
Your Personal Tour Guide
Ask me questions while you tour the home.