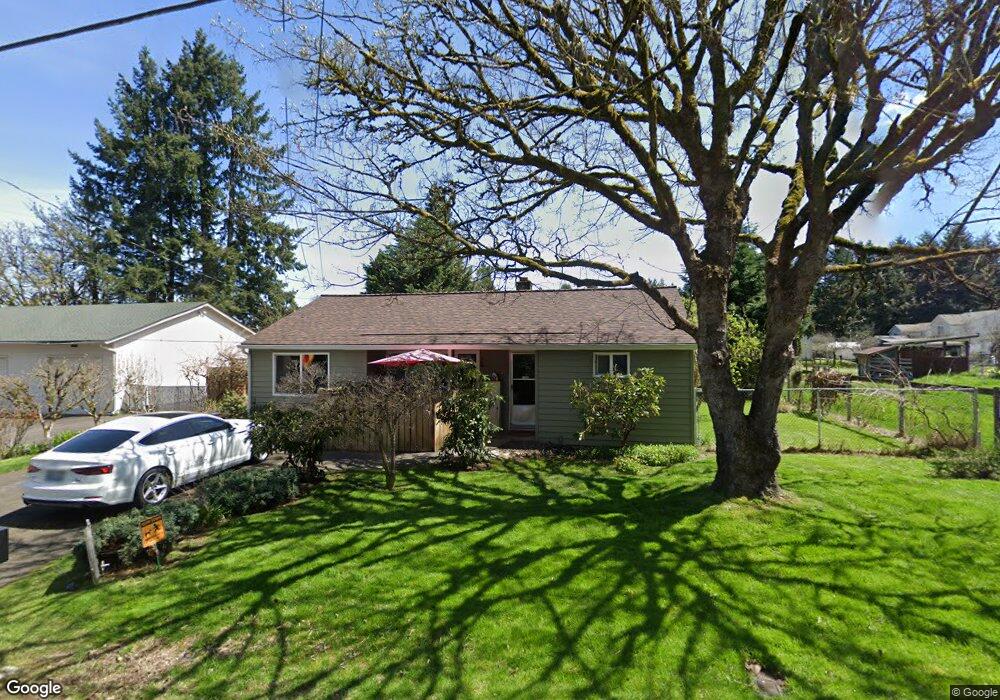
5705 NE 56th Ave Vancouver, WA 98661
Minnehaha NeighborhoodEstimated Value: $361,669 - $414,000
2
Beds
1
Bath
972
Sq Ft
$398/Sq Ft
Est. Value
About This Home
This home is located at 5705 NE 56th Ave, Vancouver, WA 98661 and is currently estimated at $386,417, approximately $397 per square foot. 5705 NE 56th Ave is a home located in Clark County with nearby schools including Minnehaha Elementary School, Jason Lee Middle School, and Hudson's Bay High School.
Ownership History
Date
Name
Owned For
Owner Type
Purchase Details
Closed on
Feb 4, 2008
Sold by
Prudential Relocation Inc
Bought by
Noell Amy
Current Estimated Value
Home Financials for this Owner
Home Financials are based on the most recent Mortgage that was taken out on this home.
Original Mortgage
$181,550
Outstanding Balance
$114,397
Interest Rate
6.04%
Mortgage Type
Purchase Money Mortgage
Estimated Equity
$272,020
Purchase Details
Closed on
Nov 30, 2007
Sold by
May Spencer A and May Carol
Bought by
Prudential Relocation Inc
Purchase Details
Closed on
Dec 5, 2002
Sold by
Goodenough Gary and Goodenough Cathy L
Bought by
Koenig Dean Scott
Home Financials for this Owner
Home Financials are based on the most recent Mortgage that was taken out on this home.
Original Mortgage
$98,750
Interest Rate
6.28%
Mortgage Type
FHA
Purchase Details
Closed on
Nov 25, 2002
Sold by
Koenig Dean Scott
Bought by
Chukwu Ifeanyi
Home Financials for this Owner
Home Financials are based on the most recent Mortgage that was taken out on this home.
Original Mortgage
$98,750
Interest Rate
6.28%
Mortgage Type
FHA
Create a Home Valuation Report for This Property
The Home Valuation Report is an in-depth analysis detailing your home's value as well as a comparison with similar homes in the area
Home Values in the Area
Average Home Value in this Area
Purchase History
| Date | Buyer | Sale Price | Title Company |
|---|---|---|---|
| Noell Amy | $181,550 | Fidelity National Title | |
| Prudential Relocation Inc | $181,550 | Fidelity National Title | |
| Koenig Dean Scott | -- | Fidelity National Title | |
| Chukwu Ifeanyi | $100,300 | Fidelity National Title |
Source: Public Records
Mortgage History
| Date | Status | Borrower | Loan Amount |
|---|---|---|---|
| Open | Noell Amy | $181,550 | |
| Previous Owner | Chukwu Ifeanyi | $98,750 |
Source: Public Records
Tax History Compared to Growth
Tax History
| Year | Tax Paid | Tax Assessment Tax Assessment Total Assessment is a certain percentage of the fair market value that is determined by local assessors to be the total taxable value of land and additions on the property. | Land | Improvement |
|---|---|---|---|---|
| 2025 | $2,832 | $289,667 | $144,687 | $144,980 |
| 2024 | $2,696 | $280,581 | $144,687 | $135,894 |
| 2023 | $2,627 | $283,520 | $144,687 | $138,833 |
| 2022 | $2,452 | $276,311 | $144,687 | $131,624 |
| 2021 | $2,314 | $235,830 | $123,664 | $112,166 |
| 2020 | $2,015 | $208,804 | $108,420 | $100,384 |
| 2019 | $2,014 | $186,793 | $92,311 | $94,482 |
| 2018 | $2,058 | $194,332 | $0 | $0 |
| 2017 | $1,840 | $165,336 | $0 | $0 |
| 2016 | $1,711 | $155,387 | $0 | $0 |
| 2015 | $1,618 | $133,919 | $0 | $0 |
| 2014 | -- | $119,179 | $0 | $0 |
| 2013 | -- | $97,621 | $0 | $0 |
Source: Public Records
Map
Nearby Homes
- 0 NE 56th Ave
- 5616 NE 59th Way
- 6007 NE 55th Cir
- 5320 NE 54th St
- 5517 NE 61st Ct
- 5710 NE 62nd St
- 5503 NE 53rd Cir
- 5310 NE 53rd Ct
- 5415 NE 52nd St
- 6000 NE 51st Ave
- 6314 NE 58th St
- 5407 NE 65th St
- 5411 NE 65th St
- 5415 NE 65th St
- 5505 NE 65th St
- 5501 NE 65th St
- 5419 NE 65th St
- 5403 NE 65th Place
- 6314 NE 62nd Place
- Magnolia Plan at Cottages at 66th
- 5615 NE 56th Ave
- 5715 NE 56th Ave
- 5615 NE 58th St
- 5624 NE 56th Ave
- 5515 NE 58th St
- 5701 NE 58th St
- 5609 NE 56th Ave
- 5620 NE 56th Ave
- 5620 NE 58th Ct
- 5618 NE 58th Ct
- 5704 NE 58th Ct
- 5704 NE 58th Ct
- 5601 NE 58th Way
- 5704 NE 58th Way
- 5618 NE 56th Ave
- 5605 NE 58th Way
- 5601 NE 58th Way
- 5609 NE 58th Way
- 5613 NE 58th Way
- 5617 NE 58th Way