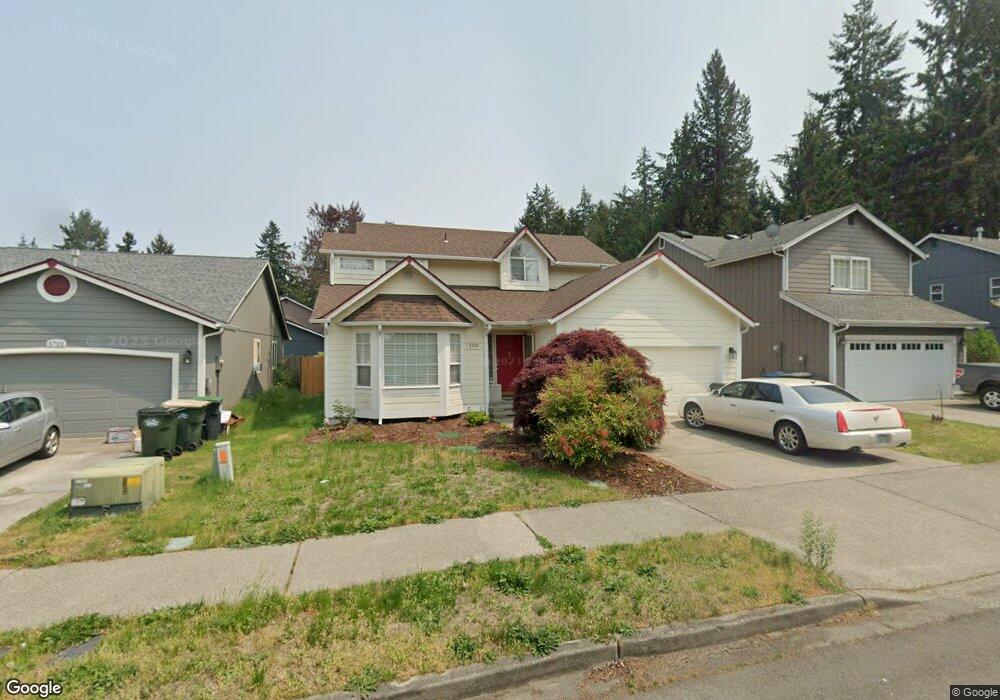
5705 Rumac St SE Lacey, WA 98513
The Lakes NeighborhoodEstimated Value: $481,000 - $494,000
4
Beds
3
Baths
1,747
Sq Ft
$279/Sq Ft
Est. Value
About This Home
This home is located at 5705 Rumac St SE, Lacey, WA 98513 and is currently estimated at $487,401, approximately $278 per square foot. 5705 Rumac St SE is a home located in Thurston County with nearby schools including Lakes Elementary School, Komachin Middle School, and Timberline High School.
Ownership History
Date
Name
Owned For
Owner Type
Purchase Details
Closed on
Sep 25, 2023
Sold by
Roberts Paul B
Bought by
Gbehan-Heard Nickesha and Herrera Juan
Current Estimated Value
Home Financials for this Owner
Home Financials are based on the most recent Mortgage that was taken out on this home.
Original Mortgage
$460,000
Outstanding Balance
$444,184
Interest Rate
4%
Mortgage Type
VA
Estimated Equity
$43,217
Purchase Details
Closed on
Oct 20, 2000
Sold by
Donohue Construction Company Inc
Bought by
Cross William E and Cross Virginia M
Home Financials for this Owner
Home Financials are based on the most recent Mortgage that was taken out on this home.
Original Mortgage
$116,053
Interest Rate
7.9%
Mortgage Type
FHA
Purchase Details
Closed on
Aug 14, 1997
Sold by
Donohue Construction Co Inc
Bought by
Cross William E and Cross Virginia M
Home Financials for this Owner
Home Financials are based on the most recent Mortgage that was taken out on this home.
Original Mortgage
$95,800
Interest Rate
8.62%
Create a Home Valuation Report for This Property
The Home Valuation Report is an in-depth analysis detailing your home's value as well as a comparison with similar homes in the area
Home Values in the Area
Average Home Value in this Area
Purchase History
| Date | Buyer | Sale Price | Title Company |
|---|---|---|---|
| Gbehan-Heard Nickesha | $460,000 | Aegis Land Title | |
| Cross William E | $135,800 | Chicago Title Insurance Co | |
| Cross William E | $135,800 | First American Title Ins Co |
Source: Public Records
Mortgage History
| Date | Status | Borrower | Loan Amount |
|---|---|---|---|
| Open | Gbehan-Heard Nickesha | $460,000 | |
| Previous Owner | Cross William E | $116,053 | |
| Previous Owner | Cross William E | $95,800 |
Source: Public Records
Tax History Compared to Growth
Tax History
| Year | Tax Paid | Tax Assessment Tax Assessment Total Assessment is a certain percentage of the fair market value that is determined by local assessors to be the total taxable value of land and additions on the property. | Land | Improvement |
|---|---|---|---|---|
| 2024 | $3,861 | $426,600 | $128,200 | $298,400 |
| 2023 | $3,861 | $403,600 | $107,000 | $296,600 |
| 2022 | $3,893 | $402,700 | $71,700 | $331,000 |
| 2021 | $3,395 | $334,500 | $77,500 | $257,000 |
| 2020 | $3,118 | $271,700 | $72,100 | $199,600 |
| 2019 | $2,697 | $259,200 | $63,600 | $195,600 |
| 2018 | $2,985 | $222,300 | $41,700 | $180,600 |
| 2017 | $2,668 | $209,250 | $40,550 | $168,700 |
| 2016 | $2,598 | $199,600 | $45,700 | $153,900 |
| 2014 | -- | $198,700 | $45,700 | $153,000 |
Source: Public Records
Map
Nearby Homes
- 6822 57th Ct SE
- 5614 Vincent Ct SE
- 5928 Beltway Loop SE
- 7317 Fair Oaks Rd SE
- 6427 Candace Ct SE
- 7308 Fair Oaks Rd SE
- 5415 Komachin Loop SE
- 5425 Atchinson Dr SE
- 6112 Thornbury Ct SE
- 4748 Lakeshore Ln SE Unit B
- 7007 Mullen Rd SE
- 7519 Atchinson Dr SE
- 6008 Thornbury Dr SE
- 7349 Fair Oaks Rd SE
- 7604 Brianna Ct SE
- 6038 Illinois Ln SE Unit A
- 7506 50th Ave SE
- 5922 Illinois Ln SE Unit A
- 7638 Brianna Ct SE
- 5509 Topaz St SE
- 5709 Rumac St SE
- 6805 57th Ct SE
- 5713 Rumac St SE
- 0 57th Ct SE
- 6815 57th Ct SE
- 6809 57th Ct SE
- 6821 57th Ct SE
- 5620 Rumac St SE
- 6804 57th Ct SE
- 6823 57th Ct SE
- 6682 57th Ave SE
- 5610 Rumac St SE
- 6808 57th Ct SE
- 6655 57th Ave SE
- 6654 Columbine Ct SE
- 6827 57th Ct SE
- 5580 Rumac St SE
- 5581 Rumac St SE
- 6818 57th Ct SE