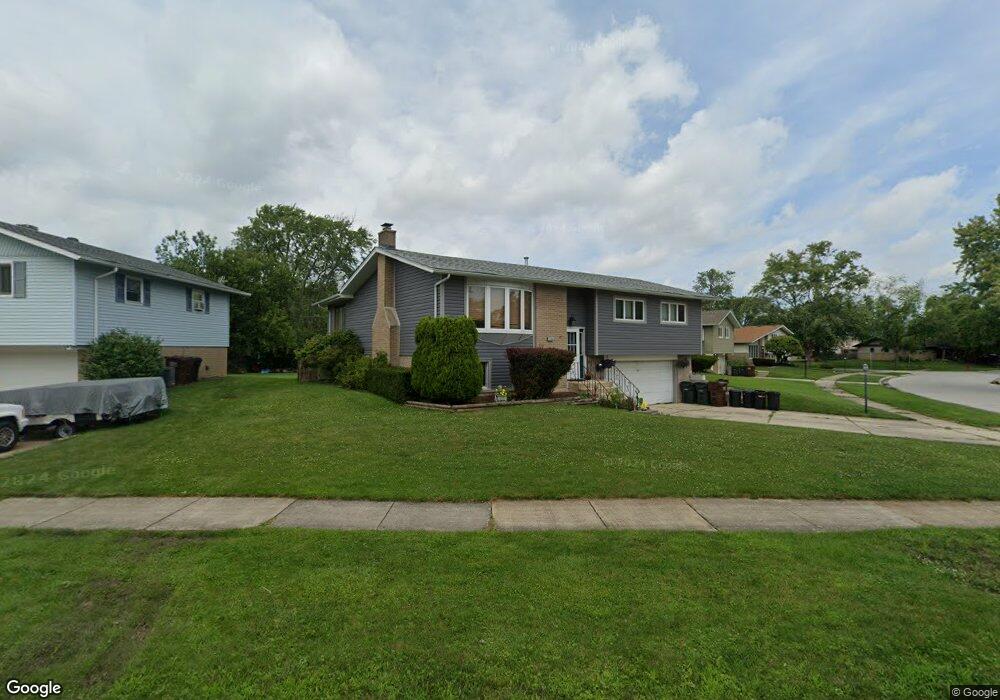
5706 La Palm Dr Oak Forest, IL 60452
Estimated Value: $241,000 - $305,000
3
Beds
2
Baths
1,283
Sq Ft
$219/Sq Ft
Est. Value
About This Home
This home is located at 5706 La Palm Dr, Oak Forest, IL 60452 and is currently estimated at $280,970, approximately $218 per square foot. 5706 La Palm Dr is a home located in Cook County with nearby schools including Kerkstra Elementary School, Jack Hille Middle School, and Oak Forest High School.
Ownership History
Date
Name
Owned For
Owner Type
Purchase Details
Closed on
Feb 27, 2017
Sold by
Maraldo Anthony
Bought by
First Midwest Bank
Current Estimated Value
Purchase Details
Closed on
Oct 29, 2014
Sold by
First Midwest Bank
Bought by
Maraldo Anthony N
Home Financials for this Owner
Home Financials are based on the most recent Mortgage that was taken out on this home.
Original Mortgage
$127,000
Interest Rate
3.91%
Mortgage Type
New Conventional
Purchase Details
Closed on
Mar 5, 2007
Sold by
Maraldo Anthony
Bought by
Palos Bank & Trust Co and Trust #1-7138
Purchase Details
Closed on
Oct 16, 2003
Sold by
Bradford David J
Bought by
Maraldo Anthony
Home Financials for this Owner
Home Financials are based on the most recent Mortgage that was taken out on this home.
Original Mortgage
$151,620
Interest Rate
6.23%
Mortgage Type
FHA
Purchase Details
Closed on
Sep 15, 1998
Sold by
Maraldo Anna
Bought by
Bradford David J
Create a Home Valuation Report for This Property
The Home Valuation Report is an in-depth analysis detailing your home's value as well as a comparison with similar homes in the area
Home Values in the Area
Average Home Value in this Area
Purchase History
| Date | Buyer | Sale Price | Title Company |
|---|---|---|---|
| First Midwest Bank | -- | None Available | |
| Maraldo Anthony N | -- | None Available | |
| Palos Bank & Trust Co | -- | None Available | |
| Maraldo Anthony | $154,000 | Multiple | |
| Bradford David J | -- | Chicago Title Insurance Co |
Source: Public Records
Mortgage History
| Date | Status | Borrower | Loan Amount |
|---|---|---|---|
| Previous Owner | Maraldo Anthony N | $127,000 | |
| Previous Owner | Maraldo Anthony | $151,620 |
Source: Public Records
Tax History
| Year | Tax Paid | Tax Assessment Tax Assessment Total Assessment is a certain percentage of the fair market value that is determined by local assessors to be the total taxable value of land and additions on the property. | Land | Improvement |
|---|---|---|---|---|
| 2025 | $5,846 | $22,000 | $3,764 | $18,236 |
| 2024 | $5,846 | $22,000 | $3,764 | $18,236 |
| 2023 | $6,125 | $22,000 | $3,764 | $18,236 |
| 2022 | $6,125 | $18,008 | $3,346 | $14,662 |
| 2021 | $6,010 | $18,007 | $3,345 | $14,662 |
| 2020 | $5,868 | $18,007 | $3,345 | $14,662 |
| 2019 | $5,193 | $16,321 | $3,136 | $13,185 |
| 2018 | $5,103 | $16,321 | $3,136 | $13,185 |
| 2017 | $5,144 | $16,321 | $3,136 | $13,185 |
| 2016 | $5,073 | $14,843 | $2,927 | $11,916 |
| 2015 | $4,901 | $14,843 | $2,927 | $11,916 |
| 2014 | $4,780 | $14,843 | $2,927 | $11,916 |
| 2013 | $4,883 | $16,617 | $2,927 | $13,690 |
Source: Public Records
Map
Nearby Homes
- 15017 Sunset Ave
- 14852 Park Ave
- 15020 Park Ave
- 15201 Geoffrey Rd Unit 1
- 14708 El Vista Ave
- 14739 Park Ave
- 15118 Hillside Ave
- 15257 Rob Roy Dr
- 14533 Walden Ct Unit G2
- 14756 Lorel Ave
- 14529 Walden Ct Unit M3
- 14511 Central Ct Unit M2
- 14517 Sussex Ct Unit PH-1
- 14501 Central Ct Unit PH3
- 16207 Long Ave
- 5332 Crescent Ln Unit C
- 5341 Crescent Ln Unit D
- 15134 Laramie Ave
- 5308 Woodland Dr Unit A
- 15414 Las Flores Ln
- 5714 150th St
- 5722 150th St
- 15005 La Palm Dr
- 5711 150th St
- 14872 Massasoit Ave
- 15013 La Palm Dr
- 5725 Caletta Terrace
- 5735 Caletta Terrace
- 15001 La Palm Dr
- 14864 Massasoit Ave
- 5721 150th St
- 5730 150th St
- 15024 La Palm Dr
- 15019 La Palm Dr
- 5739 Caletta Terrace
- 14858 Massasoit Ave
- 5729 150th St
- 15006 Parkside Ave
- 15012 Parkside Ave
- 5738 150th St
Your Personal Tour Guide
Ask me questions while you tour the home.