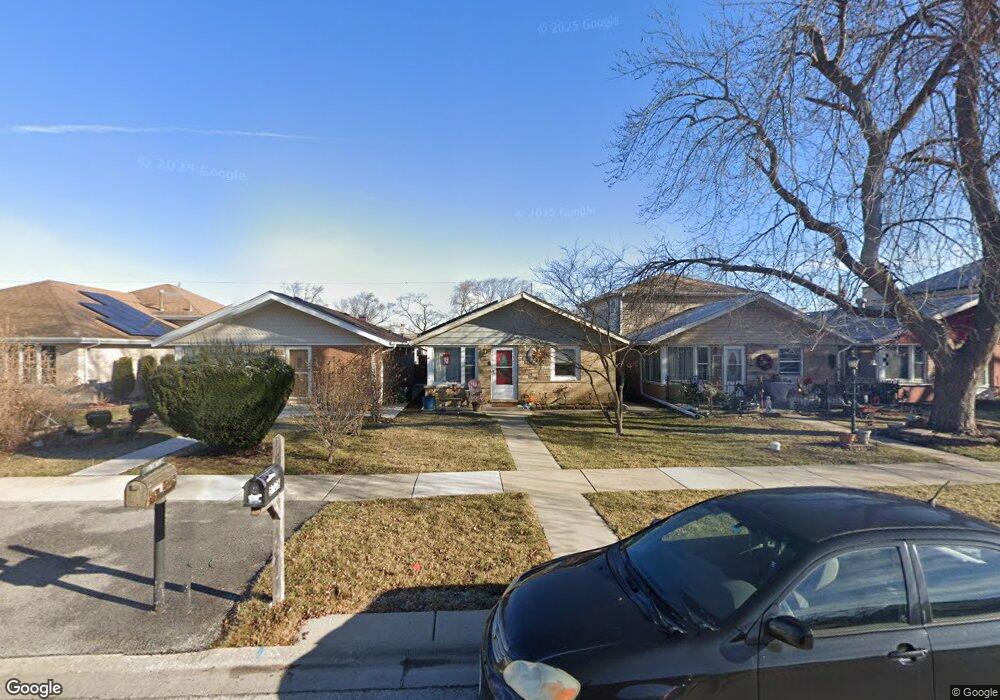
5706 W 82nd Place Burbank, IL 60459
Estimated Value: $229,000 - $304,000
3
Beds
1
Bath
1,024
Sq Ft
$256/Sq Ft
Est. Value
About This Home
This home is located at 5706 W 82nd Place, Burbank, IL 60459 and is currently estimated at $262,281, approximately $256 per square foot. 5706 W 82nd Place is a home located in Cook County with nearby schools including Luther Burbank Elementary School, Reavis High School, and St Albert the Great Catholic School.
Ownership History
Date
Name
Owned For
Owner Type
Purchase Details
Closed on
Nov 30, 2011
Sold by
Magana Armando
Bought by
Espinoza Nancy
Current Estimated Value
Home Financials for this Owner
Home Financials are based on the most recent Mortgage that was taken out on this home.
Original Mortgage
$90,642
Interest Rate
4.25%
Mortgage Type
FHA
Purchase Details
Closed on
Aug 9, 2006
Sold by
Camacho Agustin and Camacho Lisa K
Bought by
Magana Armando
Home Financials for this Owner
Home Financials are based on the most recent Mortgage that was taken out on this home.
Original Mortgage
$157,250
Interest Rate
7.55%
Mortgage Type
Unknown
Purchase Details
Closed on
Jun 27, 1996
Sold by
Rice Larry J and Rice Sandra L
Bought by
Youman Lisa K and Camacho Agustin
Home Financials for this Owner
Home Financials are based on the most recent Mortgage that was taken out on this home.
Original Mortgage
$97,495
Interest Rate
8.09%
Mortgage Type
FHA
Create a Home Valuation Report for This Property
The Home Valuation Report is an in-depth analysis detailing your home's value as well as a comparison with similar homes in the area
Home Values in the Area
Average Home Value in this Area
Purchase History
| Date | Buyer | Sale Price | Title Company |
|---|---|---|---|
| Espinoza Nancy | $93,000 | Chicago Title Insurance Co | |
| Magana Armando | $185,000 | Pntn | |
| Youman Lisa K | $98,000 | Attorneys Natl Title Network |
Source: Public Records
Mortgage History
| Date | Status | Borrower | Loan Amount |
|---|---|---|---|
| Previous Owner | Espinoza Nancy | $90,642 | |
| Previous Owner | Magana Armando | $157,250 | |
| Previous Owner | Youman Lisa K | $97,495 |
Source: Public Records
Tax History Compared to Growth
Tax History
| Year | Tax Paid | Tax Assessment Tax Assessment Total Assessment is a certain percentage of the fair market value that is determined by local assessors to be the total taxable value of land and additions on the property. | Land | Improvement |
|---|---|---|---|---|
| 2024 | $5,177 | $20,000 | $2,269 | $17,731 |
| 2023 | $4,982 | $20,000 | $2,269 | $17,731 |
| 2022 | $4,982 | $16,340 | $1,997 | $14,343 |
| 2021 | $4,800 | $16,339 | $1,996 | $14,343 |
| 2020 | $4,712 | $16,339 | $1,996 | $14,343 |
| 2019 | $3,669 | $13,669 | $1,815 | $11,854 |
| 2018 | $3,562 | $13,669 | $1,815 | $11,854 |
| 2017 | $3,464 | $13,669 | $1,815 | $11,854 |
| 2016 | $3,544 | $12,555 | $1,542 | $11,013 |
| 2015 | $3,369 | $12,555 | $1,542 | $11,013 |
| 2014 | $3,286 | $12,555 | $1,542 | $11,013 |
| 2013 | $4,317 | $14,361 | $1,542 | $12,819 |
Source: Public Records
Map
Nearby Homes
- 5724 W 82nd Place
- 5707 W 82nd Place
- 5733 W 83rd Place
- 5830 W 81st St
- 8218 Linder Ave
- 5938 W 83rd St
- 5613 W 84th Place
- 5610 W 85th St
- 8026 Linder Ave
- 8506 Parkside Ave
- 8244 Austin Ave
- 8146 Austin Ave
- 8525 Massasoit Ave
- 8535 Mansfield Ave
- 8558 Parkside Ave
- 7840 Massasoit Ave
- 7927 Lotus Ave
- 5400 W 85th St
- 7840 Monitor Ave
- 7814 Major Ave
- 5704 W 82nd Place
- 5702 W 82nd Place
- 5722 W 82nd Place
- 5700 W 82nd Place
- 5709 W 82nd St
- 5705 W 82nd St
- 5711 W 82nd St
- 5703 W 82nd St
- 5715 W 82nd St
- 5656 W 82nd Place
- 5705 W 82nd Place
- 5728 W 82nd Place
- 5711 W 82nd Place
- 5711 W 82nd Place
- 5641 W 82nd St
- 5703 W 82nd Place
- 5715 W 82nd Place
- 5715 W 82nd Place
- 5717 W 82nd St
- 5639 W 82nd St