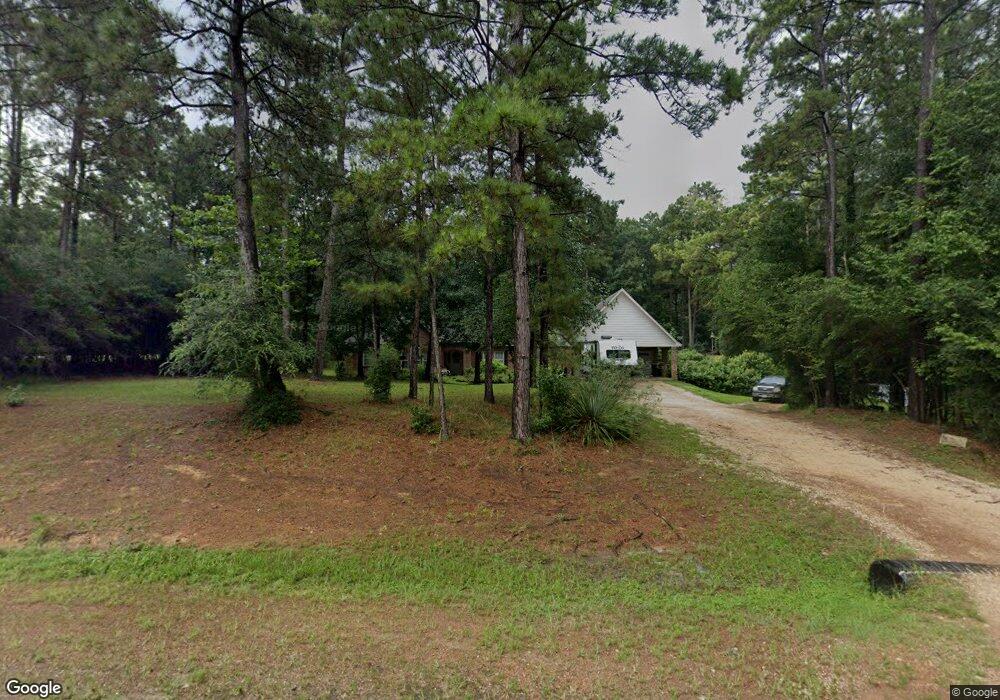
5707 Ranch Hill Dr Magnolia, TX 77354
Estimated Value: $574,000 - $603,000
3
Beds
3
Baths
2,482
Sq Ft
$238/Sq Ft
Est. Value
About This Home
This home is located at 5707 Ranch Hill Dr, Magnolia, TX 77354 and is currently estimated at $591,318, approximately $238 per square foot. 5707 Ranch Hill Dr is a home located in Montgomery County with nearby schools including Tom R. Ellisor Elementary School, Bear Branch Junior High School, and Magnolia High School.
Ownership History
Date
Name
Owned For
Owner Type
Purchase Details
Closed on
May 22, 2012
Sold by
Slade Larry W and Slade Debra A
Bought by
Mckenzie Jason E
Current Estimated Value
Home Financials for this Owner
Home Financials are based on the most recent Mortgage that was taken out on this home.
Original Mortgage
$110,000
Outstanding Balance
$15,624
Interest Rate
3.9%
Mortgage Type
New Conventional
Estimated Equity
$575,694
Purchase Details
Closed on
Feb 14, 1997
Sold by
Garcia Raul and Garcia Maria J
Bought by
Slade Larry W and Slade Debra A
Home Financials for this Owner
Home Financials are based on the most recent Mortgage that was taken out on this home.
Original Mortgage
$17,550
Interest Rate
7.85%
Purchase Details
Closed on
Jul 21, 1993
Sold by
Bluegreen Southwest
Bought by
Mckenzie Jason E
Create a Home Valuation Report for This Property
The Home Valuation Report is an in-depth analysis detailing your home's value as well as a comparison with similar homes in the area
Home Values in the Area
Average Home Value in this Area
Purchase History
| Date | Buyer | Sale Price | Title Company |
|---|---|---|---|
| Mckenzie Jason E | -- | First American Title | |
| Slade Larry W | -- | -- | |
| Mckenzie Jason E | -- | -- |
Source: Public Records
Mortgage History
| Date | Status | Borrower | Loan Amount |
|---|---|---|---|
| Open | Mckenzie Jason E | $110,000 | |
| Previous Owner | Slade Larry W | $17,550 |
Source: Public Records
Tax History Compared to Growth
Tax History
| Year | Tax Paid | Tax Assessment Tax Assessment Total Assessment is a certain percentage of the fair market value that is determined by local assessors to be the total taxable value of land and additions on the property. | Land | Improvement |
|---|---|---|---|---|
| 2025 | $6,572 | $556,455 | -- | -- |
| 2024 | $5,871 | $505,868 | -- | -- |
| 2023 | $5,871 | $459,880 | $105,600 | $549,360 |
| 2022 | $7,377 | $418,070 | $105,600 | $312,470 |
| 2021 | $7,249 | $390,000 | $74,760 | $315,240 |
| 2020 | $7,235 | $357,500 | $74,760 | $285,240 |
| 2019 | $7,058 | $350,450 | $74,760 | $289,790 |
| 2018 | $6,049 | $318,590 | $74,760 | $243,830 |
| 2017 | $6,865 | $323,730 | $74,760 | $248,970 |
| 2016 | $6,865 | $323,730 | $74,760 | $248,970 |
| 2015 | $6,506 | $333,690 | $74,760 | $260,530 |
| 2014 | $6,506 | $303,350 | $29,900 | $273,450 |
Source: Public Records
Map
Nearby Homes
- 1817 Ranch Trail Ct
- 6221 Ranch Lake Dr
- 902 Mesquite Dr
- 711 Shadberry Dr
- 6422 Sugar Bush Dr
- 6114 E Bluff Dr
- 803 Box Elder Dr
- 906 Weeping Willow Way
- 2302 E Blue Lake Dr
- 5918 Mahogany Way
- 6107 Cypress Way Dr
- 914 Box Elder Dr
- 1518 Honea Egypt Rd
- 502 Garrett Dr
- 2426 Blue Lake Dr
- 1411 Honea Egypt Rd
- 2 Lake Forest Dr
- 4 Lake Forest Dr
- 5503 Teakwood Ln
- 15456 Bedford Ln
- 1707 Cattle Dr
- 1714 Cattle Dr
- 5706 Ranch Hill Dr Unit 1150
- 5714 Ranch Hill Dr
- 5807 Ranch Hill Dr
- 1623 Cattle Dr
- 5815 Ranch Hill Dr
- 5722 Ranch Hill Dr
- 1706 Cattle Dr
- 5622 Ranch Hill Dr
- 5814 Ranch Hill Dr
- 1615 Cattle Dr
- 0000 Fm 2445
- 5615 Ranch Hill Dr
- 5722 Stone Creek Dr
- 5614 Ranch Hill Dr
- 5714 Stone Creek Dr
- 5906 Stone Creek Dr
- 5606 Ranch Hill Dr
- 5818 Stone Creek Dr