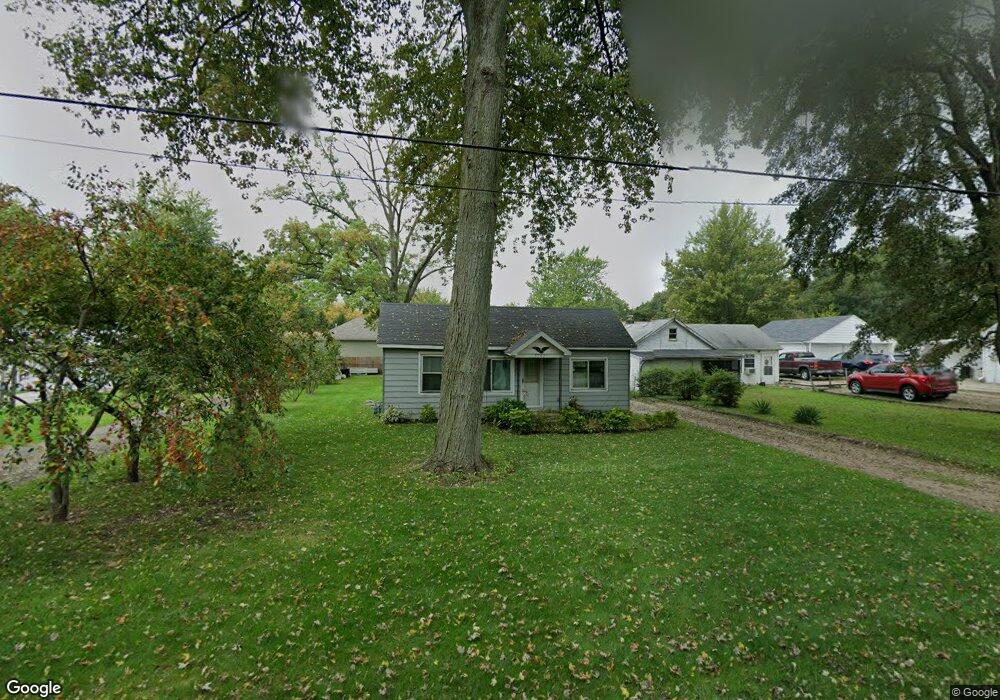
5707 Rudyard Rd Sylvania, OH 43560
Estimated Value: $122,000 - $132,000
2
Beds
1
Bath
896
Sq Ft
$141/Sq Ft
Est. Value
About This Home
This home is located at 5707 Rudyard Rd, Sylvania, OH 43560 and is currently estimated at $126,762, approximately $141 per square foot. 5707 Rudyard Rd is a home located in Lucas County with nearby schools including Hill View Elementary School, Sylvania Arbor Hills Junior High School, and Sylvania Northview High School.
Ownership History
Date
Name
Owned For
Owner Type
Purchase Details
Closed on
Aug 8, 2025
Sold by
Lewallen Dennis E
Bought by
Stewart Kylee E
Current Estimated Value
Home Financials for this Owner
Home Financials are based on the most recent Mortgage that was taken out on this home.
Original Mortgage
$120,280
Outstanding Balance
$120,176
Interest Rate
6.72%
Mortgage Type
New Conventional
Estimated Equity
$6,586
Purchase Details
Closed on
Apr 7, 2000
Sold by
Lucille Lewallen and Lucille A
Bought by
Lewallen Dennis F and Lewallen Leslie L
Purchase Details
Closed on
Aug 3, 1990
Sold by
Lewallen Lewallen C C and Lewallen L
Create a Home Valuation Report for This Property
The Home Valuation Report is an in-depth analysis detailing your home's value as well as a comparison with similar homes in the area
Home Values in the Area
Average Home Value in this Area
Purchase History
| Date | Buyer | Sale Price | Title Company |
|---|---|---|---|
| Stewart Kylee E | $124,000 | None Listed On Document | |
| Lewallen Dennis F | -- | -- | |
| -- | -- | -- |
Source: Public Records
Mortgage History
| Date | Status | Borrower | Loan Amount |
|---|---|---|---|
| Open | Stewart Kylee E | $120,280 |
Source: Public Records
Tax History Compared to Growth
Tax History
| Year | Tax Paid | Tax Assessment Tax Assessment Total Assessment is a certain percentage of the fair market value that is determined by local assessors to be the total taxable value of land and additions on the property. | Land | Improvement |
|---|---|---|---|---|
| 2024 | $810 | $34,125 | $10,780 | $23,345 |
| 2023 | $1,874 | $33,495 | $11,200 | $22,295 |
| 2022 | $2,548 | $33,495 | $11,200 | $22,295 |
| 2021 | $2,609 | $33,495 | $11,200 | $22,295 |
| 2020 | $2,475 | $28,105 | $9,450 | $18,655 |
| 2019 | $2,385 | $28,105 | $9,450 | $18,655 |
| 2018 | $2,162 | $28,105 | $9,450 | $18,655 |
| 2017 | $2,098 | $22,470 | $7,070 | $15,400 |
| 2016 | $2,059 | $64,200 | $20,200 | $44,000 |
| 2015 | $1,943 | $64,200 | $20,200 | $44,000 |
| 2014 | $1,817 | $21,600 | $6,790 | $14,810 |
| 2013 | $1,817 | $21,600 | $6,790 | $14,810 |
Source: Public Records
Map
Nearby Homes