
Landlord's Agent in 2024
FIFI CHEN
Georgia Realty Brokers International Corporation
(470) 326-9998
39 Total Sales
Estimated Value: $454,000 - $500,000
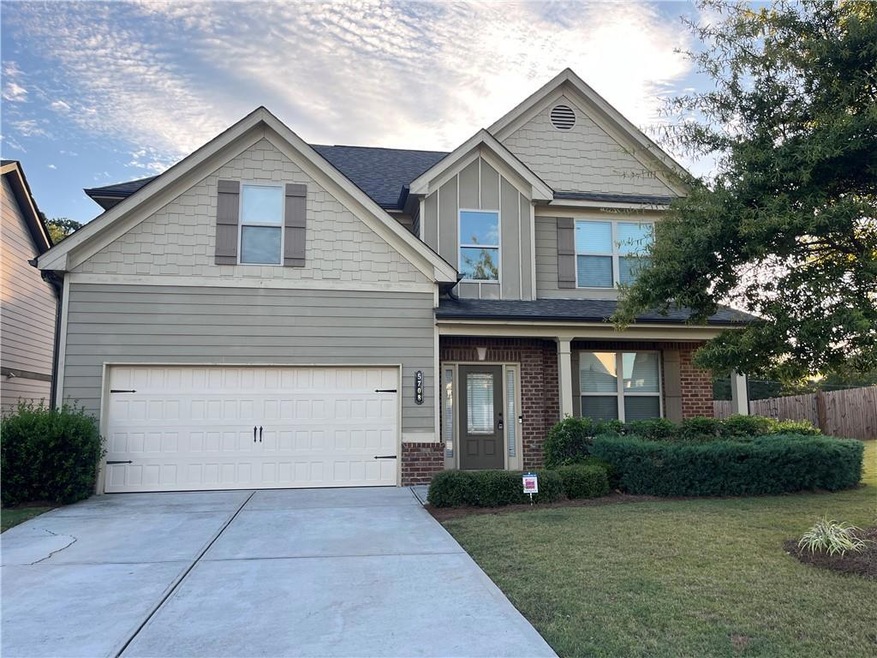
This house in great neighborhood in desirable Flowery Branch, Open floor plan. The island Kitchen with adjoining Great Room creates an open, yet inclusive atmosphere. Designer finishes include hardwoods throughout entire first floor, upgraded white cabinets, tile backsplash, granite counters, stainless steel appliances and walk-in pantry.Gas log fireplace. 2 car garage. Large master with sitting room. His & Her vanities & closets. Walking trails, pool & clubhouse. Beautiful new home in prime location. Convenient to Gainesville, Braselton & North Gwinnett. Alberta Park, Old Federal Park is at end of road, which features a park, swim area and boat ramp, 1.5 miles from Lake Lanier! minutes to I-985, downtown Flowery Branch, Mall of Georgia. some file photos.
Last Agent to Rent the Property
Georgia Realty Brokers International Corporation License #351902 Listed on: 09/06/2024
Last Renter's Agent
NON-MLS NMLS
Non FMLS Member
| Date | Buyer | Sale Price | Title Company |
|---|---|---|---|
| Yikai Zhang | $246,300 | -- | |
| Land Investment Partners Llc 12 | $2,124,000 | -- | |
| United Community Bank | $4,200,000 | -- |
| Date | Event | Price | List to Sale | Price per Sq Ft | Prior Sale |
|---|---|---|---|---|---|
| 10/01/2024 10/01/24 | Rented | $2,295 | 0.0% | -- | |
| 09/19/2024 09/19/24 | Under Contract | -- | -- | -- | |
| 09/06/2024 09/06/24 | For Rent | $2,295 | 0.0% | -- | |
| 02/08/2018 02/08/18 | Sold | $246,270 | -1.3% | $107 / Sq Ft | View Prior Sale |
| 08/30/2017 08/30/17 | Pending | -- | -- | -- | |
| 08/10/2017 08/10/17 | For Sale | $249,490 | -- | $108 / Sq Ft |
| Year | Tax Paid | Tax Assessment Tax Assessment Total Assessment is a certain percentage of the fair market value that is determined by local assessors to be the total taxable value of land and additions on the property. | Land | Improvement |
|---|---|---|---|---|
| 2024 | $4,514 | $159,160 | $20,477 | $138,683 |
| 2023 | $4,681 | $159,160 | $22,000 | $137,160 |
| 2022 | $3,976 | $124,440 | $22,000 | $102,440 |
| 2021 | $2,941 | $110,400 | $16,000 | $94,400 |
| 2020 | $3,144 | $114,680 | $18,000 | $96,680 |
| 2019 | $3,412 | $106,800 | $12,000 | $94,800 |
Landlord's Agent in 2024
FIFI CHEN
Georgia Realty Brokers International Corporation
(470) 326-9998
39 Total Sales
N
Tenant's Agent in 2024
NON-MLS NMLS
Non FMLS Member
Seller's Agent in 2018
Stephanie Cates
Park Place Brokers
(770) 378-5754
43 Total Sales
Seller Co-Listing Agent in 2018
Cathy Long
JP Murphy Realty
(770) 401-5070
33 Total Sales
Source: First Multiple Listing Service (FMLS)
MLS Number: 7451772
APN: 08-00100-01-059
Disclaimer: Certain information contained herein is derived from information provided by parties other than Homes.com. All information provided is deemed reliable, but is not guaranteed to be accurate and should be independently verified.
![]() Listings identified with the FMLS IDX logo come from FMLS and are held by brokerage firms other than the owner of this website. The listing brokerage is identified in any listing details. Information is deemed reliable but is not guaranteed. If you believe any FMLS listing contains material that infringes your copyrighted work please visit www.fmls.com/dmca to review our DMCA policy and learn how to submit a takedown request. © 2025 First Multiple Listing Service, Inc.
Listings identified with the FMLS IDX logo come from FMLS and are held by brokerage firms other than the owner of this website. The listing brokerage is identified in any listing details. Information is deemed reliable but is not guaranteed. If you believe any FMLS listing contains material that infringes your copyrighted work please visit www.fmls.com/dmca to review our DMCA policy and learn how to submit a takedown request. © 2025 First Multiple Listing Service, Inc.