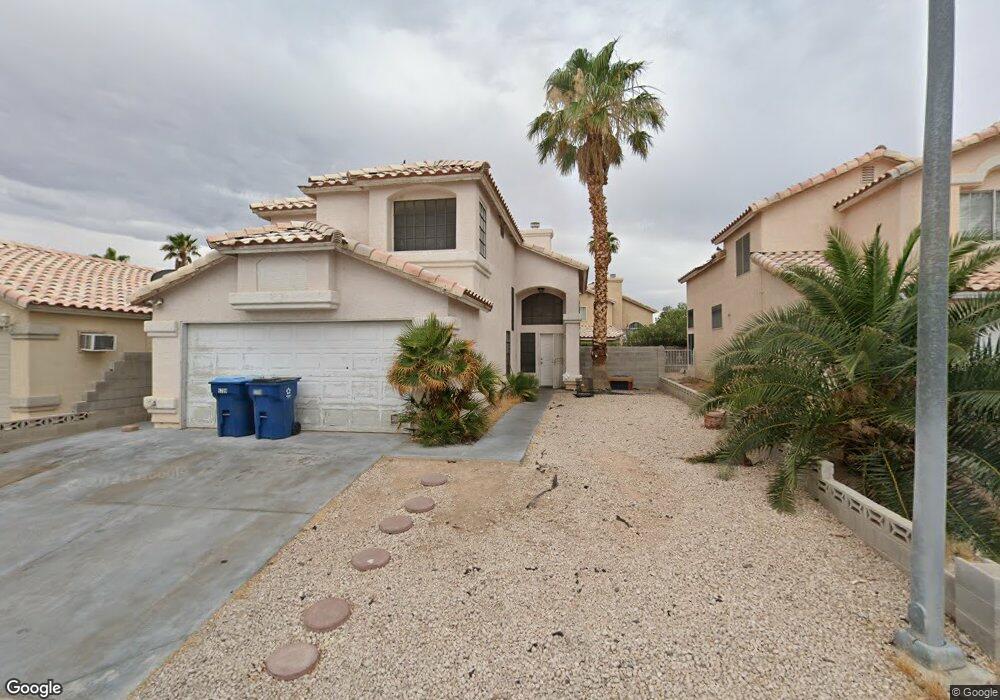
5709 Akron Ct Las Vegas, NV 89142
Estimated Value: $384,249 - $416,000
4
Beds
3
Baths
1,636
Sq Ft
$245/Sq Ft
Est. Value
About This Home
This home is located at 5709 Akron Ct, Las Vegas, NV 89142 and is currently estimated at $400,812, approximately $244 per square foot. 5709 Akron Ct is a home located in Clark County with nearby schools including John F. Mendoza Elementary School, Duane D. Keller Middle School, and Las Vegas High School.
Ownership History
Date
Name
Owned For
Owner Type
Purchase Details
Closed on
Dec 4, 2008
Sold by
Morequity Inc
Bought by
Montano Irma and Montano Patricia
Current Estimated Value
Purchase Details
Closed on
Sep 16, 2008
Sold by
Alcala Sandra
Bought by
Morequity Inc
Purchase Details
Closed on
Dec 29, 2003
Sold by
Muench Charles A
Bought by
Muench Charles A and Muench Lubov K
Purchase Details
Closed on
Sep 10, 2002
Sold by
Carroll Colleen K and Murphy Jefferson D
Bought by
Alcala Sandra
Home Financials for this Owner
Home Financials are based on the most recent Mortgage that was taken out on this home.
Original Mortgage
$148,494
Interest Rate
6.22%
Mortgage Type
FHA
Purchase Details
Closed on
Aug 14, 2001
Sold by
Carroll Colleen K
Bought by
Murphy Jefferson D and Carroll Colleen K
Home Financials for this Owner
Home Financials are based on the most recent Mortgage that was taken out on this home.
Original Mortgage
$130,500
Interest Rate
7.19%
Create a Home Valuation Report for This Property
The Home Valuation Report is an in-depth analysis detailing your home's value as well as a comparison with similar homes in the area
Home Values in the Area
Average Home Value in this Area
Purchase History
| Date | Buyer | Sale Price | Title Company |
|---|---|---|---|
| Montano Irma | $135,000 | Noble Title | |
| Morequity Inc | $157,250 | Fidelity National | |
| Muench Charles A | -- | -- | |
| Alcala Sandra | $151,000 | Fidelity National Title | |
| Murphy Jefferson D | -- | Fidelity National Title |
Source: Public Records
Mortgage History
| Date | Status | Borrower | Loan Amount |
|---|---|---|---|
| Previous Owner | Alcala Sandra | $148,494 | |
| Previous Owner | Murphy Jefferson D | $130,500 |
Source: Public Records
Tax History Compared to Growth
Tax History
| Year | Tax Paid | Tax Assessment Tax Assessment Total Assessment is a certain percentage of the fair market value that is determined by local assessors to be the total taxable value of land and additions on the property. | Land | Improvement |
|---|---|---|---|---|
| 2025 | $1,495 | $74,213 | $22,750 | $51,463 |
| 2024 | $1,283 | $74,213 | $22,750 | $51,463 |
| 2023 | $1,283 | $75,467 | $26,250 | $49,217 |
| 2022 | $1,188 | $66,890 | $21,700 | $45,190 |
| 2021 | $1,100 | $63,153 | $19,950 | $43,203 |
| 2020 | $1,019 | $61,914 | $18,900 | $43,014 |
| 2019 | $955 | $58,603 | $16,100 | $42,503 |
| 2018 | $911 | $54,188 | $13,300 | $40,888 |
| 2017 | $1,507 | $51,379 | $9,800 | $41,579 |
| 2016 | $854 | $46,047 | $8,400 | $37,647 |
| 2015 | $851 | $33,746 | $5,600 | $28,146 |
| 2014 | $825 | $27,540 | $5,250 | $22,290 |
Source: Public Records
Map
Nearby Homes
- 2229 Bowstring Dr
- 1841 Skywood Way
- 5849 Emerald Canyon Dr
- 2306 Abarth St
- 2307 Tuscarora Ct
- 1950 Abarth St
- 5650 E Sahara Ave Unit 2007
- 5650 E Sahara Ave Unit 1035
- 1950 Turtlerock St
- 1745 Starridge Way
- 1728 S Christy Ln
- 1631 Mapleleaf St
- 1919 Niblick Cir
- 5655 E Sahara Ave Unit 2048
- 5655 E Sahara Ave Unit 2009
- 5655 E Sahara Ave Unit 1003
- 5655 E Sahara Ave Unit 2068
- 5655 E Sahara Ave Unit 2020
- 1721 Starridge Way
- 1747 Angel Falls St
- 5717 Akron Ct
- 5699 Akron Ct
- 5727 Akron Ct
- 5708 Baffy Cir
- 5718 Baffy Cir
- 2080 Bowstring Dr
- 5735 Akron Ct
- 2070 Bowstring Dr
- 5728 Baffy Cir
- 2090 Bowstring Dr
- 5712 Akron Ct
- 5704 Akron Ct
- 2060 Bowstring Dr
- 5694 Akron Ct
- 5720 Akron Ct
- 5736 Baffy Cir
- 2120 Bowstring Dr
- 5743 Akron Ct
- 5728 Akron Ct
- 2050 Bowstring Dr