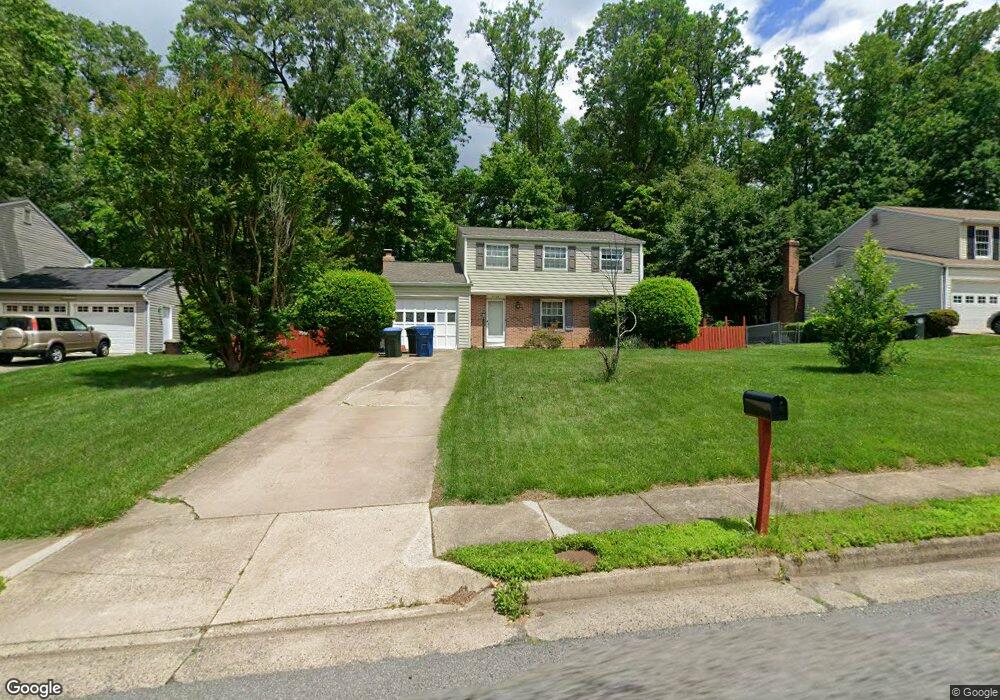
5709 Heming Ave Springfield, VA 22151
Estimated Value: $725,922 - $781,000
3
Beds
3
Baths
1,656
Sq Ft
$451/Sq Ft
Est. Value
About This Home
This home is located at 5709 Heming Ave, Springfield, VA 22151 and is currently estimated at $746,731, approximately $450 per square foot. 5709 Heming Ave is a home located in Fairfax County with nearby schools including North Springfield Elementary School, Holmes Middle School, and Annandale High School.
Ownership History
Date
Name
Owned For
Owner Type
Purchase Details
Closed on
Dec 18, 2015
Sold by
Mastrofini Leonard A and Williams Jennie Linn
Bought by
Mastrofini Leonard A
Current Estimated Value
Home Financials for this Owner
Home Financials are based on the most recent Mortgage that was taken out on this home.
Original Mortgage
$76,000
Outstanding Balance
$60,323
Interest Rate
3.98%
Mortgage Type
Credit Line Revolving
Estimated Equity
$686,408
Purchase Details
Closed on
Jun 19, 2001
Sold by
Thiel David A
Bought by
Tekeste Endalkachen
Purchase Details
Closed on
May 2, 1994
Sold by
Mastrofini Edy
Bought by
Mastrofini Leonard A
Home Financials for this Owner
Home Financials are based on the most recent Mortgage that was taken out on this home.
Original Mortgage
$70,000
Interest Rate
7.7%
Create a Home Valuation Report for This Property
The Home Valuation Report is an in-depth analysis detailing your home's value as well as a comparison with similar homes in the area
Home Values in the Area
Average Home Value in this Area
Purchase History
| Date | Buyer | Sale Price | Title Company |
|---|---|---|---|
| Mastrofini Leonard A | -- | None Available | |
| Tekeste Endalkachen | $439,900 | -- | |
| Mastrofini Leonard A | $95,000 | -- |
Source: Public Records
Mortgage History
| Date | Status | Borrower | Loan Amount |
|---|---|---|---|
| Open | Mastrofini Leonard A | $76,000 | |
| Open | Mastrofini Leonard A | $304,000 | |
| Previous Owner | Mastrofini Leonard A | $70,000 |
Source: Public Records
Tax History
| Year | Tax Paid | Tax Assessment Tax Assessment Total Assessment is a certain percentage of the fair market value that is determined by local assessors to be the total taxable value of land and additions on the property. | Land | Improvement |
|---|---|---|---|---|
| 2025 | $7,449 | $678,380 | $300,000 | $378,380 |
| 2024 | $7,449 | $642,980 | $280,000 | $362,980 |
| 2023 | $7,235 | $641,080 | $280,000 | $361,080 |
| 2022 | $6,673 | $583,570 | $250,000 | $333,570 |
| 2021 | $6,490 | $553,070 | $225,000 | $328,070 |
| 2020 | $6,193 | $523,260 | $225,000 | $298,260 |
| 2019 | $6,134 | $518,260 | $220,000 | $298,260 |
| 2018 | $5,678 | $493,740 | $216,000 | $277,740 |
| 2017 | $5,599 | $482,290 | $210,000 | $272,290 |
| 2016 | $5,410 | $466,950 | $200,000 | $266,950 |
Source: Public Records
Map
Nearby Homes
- 5718 Anola Ct
- 5755 Heming Ave
- 5937 Atteentee Rd
- 7500 Murillo St
- 6110 Harmon Place
- 7804 Carrleigh Pkwy
- 6112 Harmon Place
- 5908 Amelia St
- 7501 Nancemond St
- 7516 Essex Ave
- 7212 Highland St
- 7233 Evanston Rd
- 7423 Exmore St
- 7921 Foote Ln
- 5912 Minutemen Rd Unit 295
- 5633 Inverchapel Rd
- 8141 Kingsway Ct Unit 289
- 5927 Bayshire Rd Unit 115
- 7318 Chatham St
- 5401 Ferndale St
- 5707 Heming Ave
- 5713 Heming Ave
- 5708 Heming Ave
- 5710 Heming Ave
- 5705 Heming Ave
- 7633 Webbwood Ct
- 5712 Heming Ave
- 7631 Webbwood Ct
- 5715 Heming Ave
- 7627 Long Pine Dr
- 7635 Webbwood Ct
- 7629 Webbwood Ct
- 5714 Heming Ave
- 7629 Long Pine Dr
- 5704 Heming Ave
- 5703 Heming Ave
- 5717 Heming Ave
- 7627 Webbwood Ct
- 7625 Long Pine Dr
- 5716 Heming Ave
Your Personal Tour Guide
Ask me questions while you tour the home.