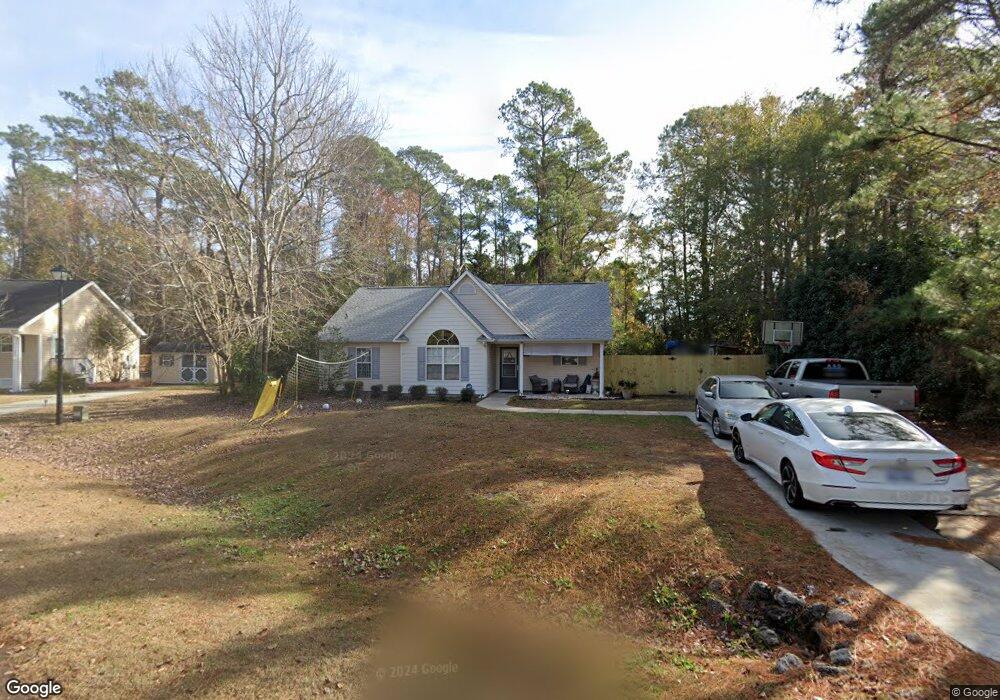
5709 Highgrove Place Wilmington, NC 28409
Estimated Value: $322,000 - $443,000
3
Beds
2
Baths
1,439
Sq Ft
$260/Sq Ft
Est. Value
About This Home
This home is located at 5709 Highgrove Place, Wilmington, NC 28409 and is currently estimated at $373,781, approximately $259 per square foot. 5709 Highgrove Place is a home located in New Hanover County with nearby schools including Heyward C. Bellamy Elementary School, Myrtle Grove Middle School, and Eugene Ashley High School.
Ownership History
Date
Name
Owned For
Owner Type
Purchase Details
Closed on
Aug 13, 2021
Sold by
Hanis Chiistine B and Grissett Jeremy
Bought by
Marshall Anthony Dion and Marshall Moran
Current Estimated Value
Home Financials for this Owner
Home Financials are based on the most recent Mortgage that was taken out on this home.
Original Mortgage
$217,979
Outstanding Balance
$198,210
Interest Rate
2.9%
Mortgage Type
FHA
Estimated Equity
$175,571
Purchase Details
Closed on
Feb 26, 2002
Sold by
Sanco Of Wilm Service Corp
Bought by
Harris Thurman B Christine B
Purchase Details
Closed on
May 17, 2001
Sold by
Home Life Inc
Bought by
Sanco Of Wilm Service Corp
Purchase Details
Closed on
Nov 14, 2000
Sold by
Lancaster John R Leticia S
Bought by
Home Life Inc
Purchase Details
Closed on
Dec 20, 1995
Sold by
Jenlyn Enterprises Inc
Bought by
Manly Developments Llc
Create a Home Valuation Report for This Property
The Home Valuation Report is an in-depth analysis detailing your home's value as well as a comparison with similar homes in the area
Home Values in the Area
Average Home Value in this Area
Purchase History
| Date | Buyer | Sale Price | Title Company |
|---|---|---|---|
| Marshall Anthony Dion | $222,000 | None Available | |
| Harris Thurman B Christine B | $124,000 | -- | |
| Sanco Of Wilm Service Corp | $27,000 | -- | |
| Home Life Inc | $200,000 | -- | |
| Lancaster John R Leticia S | $256,000 | -- | |
| Manly Developments Llc | -- | -- |
Source: Public Records
Mortgage History
| Date | Status | Borrower | Loan Amount |
|---|---|---|---|
| Open | Marshall Anthony Dion | $217,979 |
Source: Public Records
Tax History Compared to Growth
Tax History
| Year | Tax Paid | Tax Assessment Tax Assessment Total Assessment is a certain percentage of the fair market value that is determined by local assessors to be the total taxable value of land and additions on the property. | Land | Improvement |
|---|---|---|---|---|
| 2025 | $1,237 | $333,200 | $112,900 | $220,300 |
| 2023 | $1,237 | $222,600 | $62,300 | $160,300 |
| 2022 | $1,242 | $222,600 | $62,300 | $160,300 |
| 2021 | $0 | $222,600 | $62,300 | $160,300 |
| 2020 | $959 | $151,600 | $55,000 | $96,600 |
| 2019 | $951 | $150,400 | $55,000 | $95,400 |
| 2018 | $944 | $150,400 | $55,000 | $95,400 |
| 2017 | $974 | $150,400 | $55,000 | $95,400 |
| 2016 | $913 | $131,800 | $49,500 | $82,300 |
| 2015 | $849 | $131,800 | $49,500 | $82,300 |
| 2014 | $834 | $131,800 | $49,500 | $82,300 |
Source: Public Records
Map
Nearby Homes
- 5304 Masonboro Loop Rd
- 5705 Woodduck Cir
- 704 Mallard Crossing Dr
- 4809 W Grove Dr
- 301 Foxwood Ln
- 273 Foxwood Ln
- 234 Brighton Rd
- 324 Foxwood Ln
- 5500 N Warrendale Ct
- 633 Piner Rd
- 201 Southwold Dr
- 5028 Laurenbridge Ln
- 1221 S Beresford Ct
- 4922 Woods Edge Rd
- 1202 Beresford Ct
- 101 Barton Oaks Dr
- 5029 Woods Edge Rd
- 5102 Masonboro Harbour Dr
- 5200 Woods Edge Rd
- 5109 Old Myrtle Grove Rd
- 5713 Highgrove Place
- 5705 Highgrove Place
- 801 Cameo Ct
- 803 Cameo Ct
- 5701 Highgrove Place
- 5708 Highgrove Place
- 5712 Highgrove Place
- 5717 Highgrove Place
- 5704 Highgrove Place
- 5716 Highgrove Place
- 5700 Highgrove Place
- 800 Cameo Ct
- 805 Cameo Ct
- 5720 Highgrove Place
- 699 Grey Squirrel Dr
- 712 Brass Eagle Ct
- 807 Cameo Ct
- 804 Cameo Ct
- 5721 Highgrove Place
- 701 Grey Squirrel Dr