Estimated Value: $380,457 - $397,000
3
Beds
2
Baths
1,320
Sq Ft
$295/Sq Ft
Est. Value
About This Home
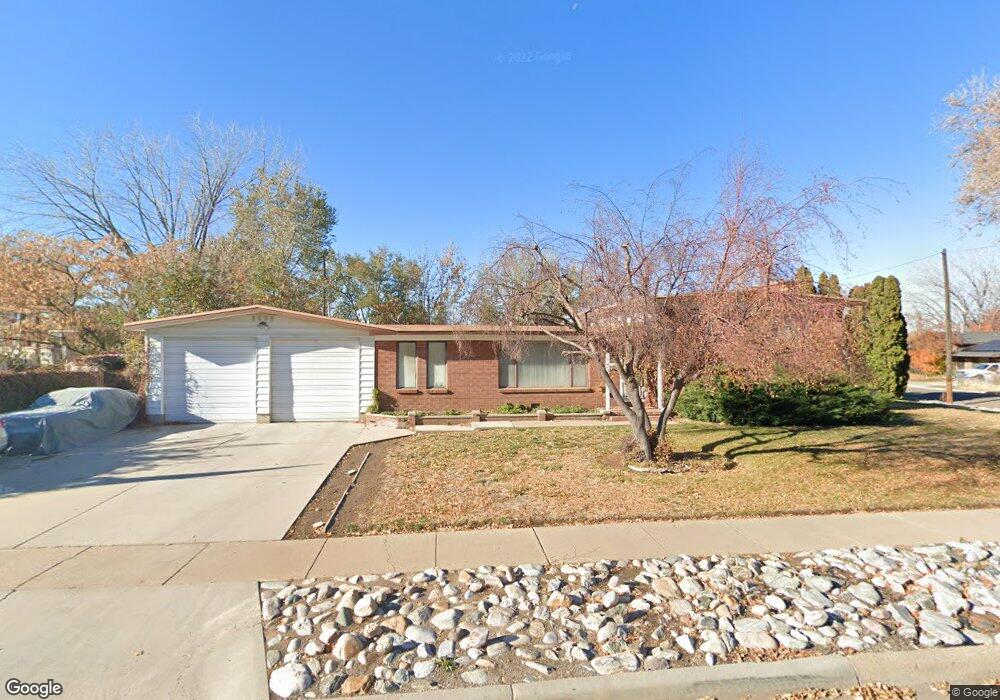
This home is located at 5709 S 2550 W, Roy, UT 84067 and is currently estimated at $389,114, approximately $294 per square foot. 5709 S 2550 W is a home located in Weber County with nearby schools including Municipal School, Roy Junior High School, and Roy High School.
Ownership History
Date
Name
Owned For
Owner Type
Purchase Details
Closed on
Oct 7, 2016
Sold by
Mcgary Teresa Kay and Panfiloff Gregory Paul
Bought by
Panfiloff Gregory P
Current Estimated Value
Purchase Details
Closed on
Sep 1, 2016
Sold by
Mcgary Teresa Kay and Panfiloff Gregory Paul
Bought by
Panfiloff Teresa Kay and Panfiloff Gregory Paul
Purchase Details
Closed on
Jan 7, 2005
Sold by
Panfiloff Mary K
Bought by
Panfiloff Mary K
Create a Home Valuation Report for This Property
The Home Valuation Report is an in-depth analysis detailing your home's value as well as a comparison with similar homes in the area
Home Values in the Area
Average Home Value in this Area
Purchase History
| Date | Buyer | Sale Price | Title Company |
|---|---|---|---|
| Panfiloff Gregory P | -- | None Available | |
| Panfiloff Teresa Kay | -- | None Available | |
| Panfiloff Mary K | -- | -- |
Source: Public Records
Tax History
| Year | Tax Paid | Tax Assessment Tax Assessment Total Assessment is a certain percentage of the fair market value that is determined by local assessors to be the total taxable value of land and additions on the property. | Land | Improvement |
|---|---|---|---|---|
| 2025 | $2,439 | $383,538 | $116,664 | $266,874 |
| 2024 | $2,358 | $205,149 | $64,175 | $140,974 |
| 2023 | $2,223 | $193,050 | $59,507 | $133,543 |
| 2022 | $2,468 | $223,300 | $57,256 | $166,044 |
| 2021 | $1,901 | $280,000 | $67,994 | $212,006 |
| 2020 | $1,828 | $248,000 | $67,994 | $180,006 |
| 2019 | $1,890 | $243,000 | $42,396 | $200,604 |
| 2018 | $1,729 | $208,000 | $37,389 | $170,611 |
| 2017 | $1,627 | $183,000 | $37,389 | $145,611 |
| 2016 | $1,091 | $87,377 | $20,121 | $67,256 |
| 2015 | $974 | $81,041 | $22,877 | $58,164 |
| 2014 | $963 | $79,353 | $17,327 | $62,026 |
Source: Public Records
Map
Nearby Homes
Your Personal Tour Guide
Ask me questions while you tour the home.