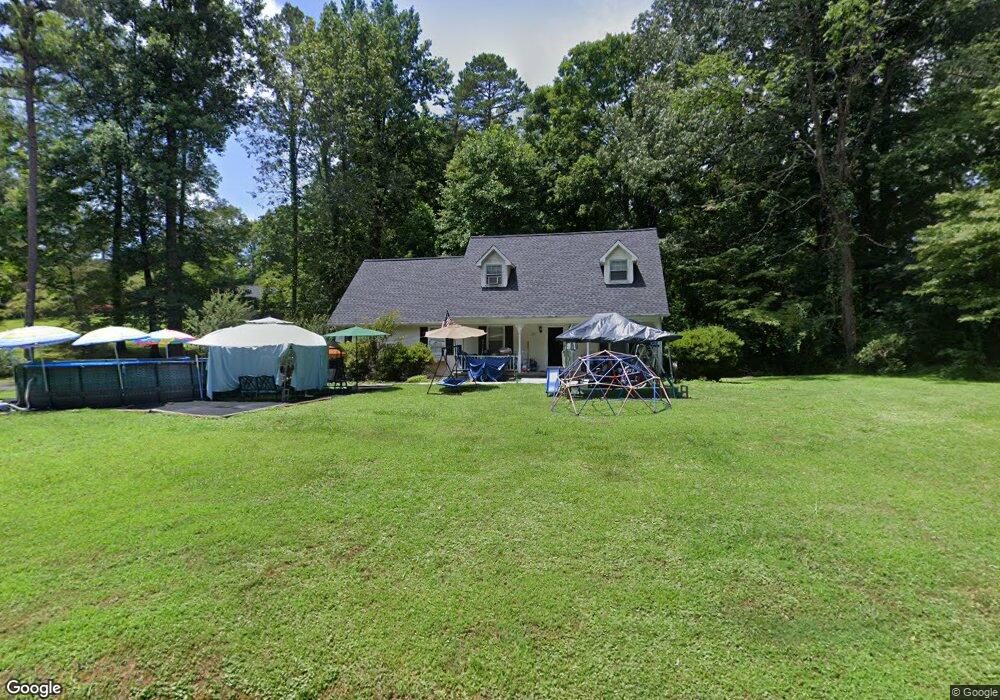
571 Chinquapin Rd Ellijay, GA 30536
Estimated Value: $332,000 - $382,000
3
Beds
3
Baths
1,612
Sq Ft
$219/Sq Ft
Est. Value
About This Home
This home is located at 571 Chinquapin Rd, Ellijay, GA 30536 and is currently estimated at $352,841, approximately $218 per square foot. 571 Chinquapin Rd is a home located in Gilmer County with nearby schools including Ellijay Elementary School, Clear Creek Elementary School, and Clear Creek Middle School.
Ownership History
Date
Name
Owned For
Owner Type
Purchase Details
Closed on
Mar 11, 2009
Sold by
Garner Jackie R
Bought by
Garner Jackie R
Current Estimated Value
Purchase Details
Closed on
Jun 28, 2004
Sold by
Relocation Center Inc
Bought by
Garner Jackie R
Purchase Details
Closed on
Jun 1, 1998
Sold by
Mitchell Paul A
Bought by
Chastain Patrick N and Chastain Christy M
Purchase Details
Closed on
Oct 1, 1994
Sold by
Chastain Patrick N
Bought by
Chastain Patrick N
Purchase Details
Closed on
Aug 1, 1994
Sold by
Chastain Patrick N
Bought by
Chastain Patrick N
Purchase Details
Closed on
Nov 1, 1992
Sold by
Chastain Patrick N
Bought by
Chastain Patrick N
Purchase Details
Closed on
Jun 1, 1992
Bought by
Chastain Patrick N
Create a Home Valuation Report for This Property
The Home Valuation Report is an in-depth analysis detailing your home's value as well as a comparison with similar homes in the area
Home Values in the Area
Average Home Value in this Area
Purchase History
| Date | Buyer | Sale Price | Title Company |
|---|---|---|---|
| Garner Jackie R | $164,900 | -- | |
| Garner Jackie R | $139,000 | -- | |
| Relocation Center Inc | $139,000 | -- | |
| Chastain Patrick N | $118,000 | -- | |
| Chastain Patrick N | $83,000 | -- | |
| Chastain Patrick N | $84,000 | -- | |
| Chastain Patrick N | $60,000 | -- | |
| Chastain Patrick N | $75,000 | -- |
Source: Public Records
Tax History Compared to Growth
Tax History
| Year | Tax Paid | Tax Assessment Tax Assessment Total Assessment is a certain percentage of the fair market value that is determined by local assessors to be the total taxable value of land and additions on the property. | Land | Improvement |
|---|---|---|---|---|
| 2025 | $346 | $100,520 | $9,200 | $91,320 |
| 2024 | $346 | $100,440 | $8,280 | $92,160 |
| 2023 | $356 | $100,640 | $8,480 | $92,160 |
| 2022 | $370 | $85,800 | $8,480 | $77,320 |
| 2021 | $411 | $68,760 | $8,480 | $60,280 |
| 2020 | $1,287 | $61,360 | $8,480 | $52,880 |
| 2019 | $1,325 | $61,360 | $8,480 | $52,880 |
| 2018 | $1,146 | $57,480 | $4,600 | $52,880 |
| 2017 | $1,058 | $46,280 | $4,600 | $41,680 |
| 2016 | $1,089 | $46,840 | $4,600 | $42,240 |
| 2015 | $993 | $42,200 | $2,400 | $39,800 |
| 2014 | $830 | $34,320 | $2,400 | $31,920 |
| 2013 | -- | $35,240 | $2,400 | $32,840 |
Source: Public Records
Map
Nearby Homes
- 0 Holly Berry Ct
- Lot 4 Mountain Trace
- Lot 4 Mountain Trace Unit 4
- Lot 8 Mountain Gate Crossing Unit 8
- Lot 8 Mountain Gate Crossing
- 0 Yukon Rd Unit 10649657
- 216 Old Orchard Square
- Lots 1-3 Ridgehaven Trail
- LOT 3 Ridgehaven Trail
- 138.06AC Georgia 515
- 0 Highland Ridge Rd Unit 7512956
- 220 Oak Ridge Ln
- 31 Willow St
- 0 Hill St
- 466 Hefner St
- 138.06 AC Georgia 515
- 0 Aspen Ave Unit 10501189
- 0 Aspen Ave Unit 1025047
- 269 Old Orchard Rd
- 81 Loper Ln
- 525 Chinquapin Rd
- 610 Chinquapin Rd
- 38 Monticello Rd
- 630 Chinquapin Rd
- 477 Chinquapin Rd
- 68 Monticello Rd
- 720 Chinquapin Rd
- 386 Chinquapin Rd
- 41 Liberty Ln
- 340 Chinquapin Rd
- 0 Independence Cir
- 367 Chinquapin Rd
- 61 Independence Cir
- 953 Liberty Rd
- 24 Liberty Ln
- 722 Chinquapin Rd
- 0 Liberty Ln
- 186 Monticello Rd
- 107 Independence Cir
- 32 Dream View Dr