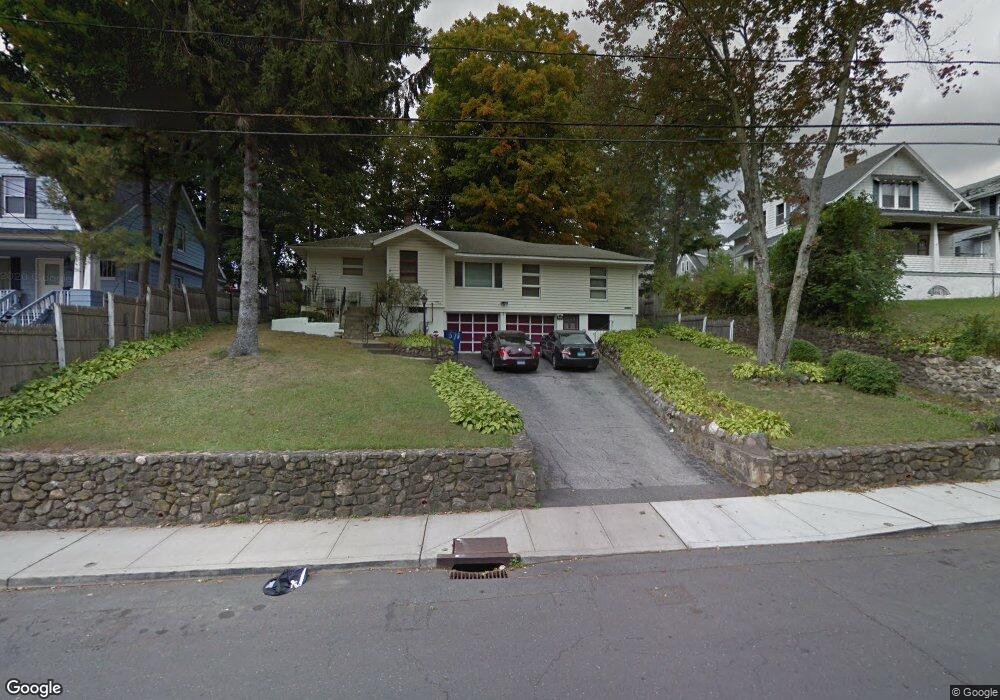
571 Cooke St Waterbury, CT 06710
Village of Waterbury NeighborhoodEstimated Value: $285,000 - $358,000
3
Beds
3
Baths
1,545
Sq Ft
$203/Sq Ft
Est. Value
About This Home
This home is located at 571 Cooke St, Waterbury, CT 06710 and is currently estimated at $314,175, approximately $203 per square foot. 571 Cooke St is a home located in New Haven County with nearby schools including F. J. Kingsbury School, North End Middle School, and Wilby High School.
Ownership History
Date
Name
Owned For
Owner Type
Purchase Details
Closed on
Mar 20, 1998
Sold by
Bank Of New York
Bought by
Roscoe Roger and Minnis Sonia
Current Estimated Value
Purchase Details
Closed on
Dec 22, 1994
Sold by
Bk Of American Natl Tr
Bought by
Douglas Linda
Create a Home Valuation Report for This Property
The Home Valuation Report is an in-depth analysis detailing your home's value as well as a comparison with similar homes in the area
Home Values in the Area
Average Home Value in this Area
Purchase History
| Date | Buyer | Sale Price | Title Company |
|---|---|---|---|
| Roscoe Roger | $63,000 | -- | |
| Douglas Linda | $75,000 | -- |
Source: Public Records
Mortgage History
| Date | Status | Borrower | Loan Amount |
|---|---|---|---|
| Open | Douglas Linda | $127,500 | |
| Closed | Douglas Linda | $128,000 | |
| Closed | Douglas Linda | $105,000 |
Source: Public Records
Tax History Compared to Growth
Tax History
| Year | Tax Paid | Tax Assessment Tax Assessment Total Assessment is a certain percentage of the fair market value that is determined by local assessors to be the total taxable value of land and additions on the property. | Land | Improvement |
|---|---|---|---|---|
| 2025 | $7,472 | $166,110 | $23,590 | $142,520 |
| 2024 | $8,212 | $166,110 | $23,590 | $142,520 |
| 2023 | $9,002 | $166,110 | $23,590 | $142,520 |
| 2022 | $5,738 | $95,300 | $23,600 | $71,700 |
| 2021 | $5,738 | $95,300 | $23,600 | $71,700 |
| 2020 | $5,738 | $95,300 | $23,600 | $71,700 |
| 2019 | $5,738 | $95,300 | $23,600 | $71,700 |
| 2018 | $5,738 | $95,300 | $23,600 | $71,700 |
| 2017 | $6,075 | $100,890 | $23,590 | $77,300 |
| 2016 | $6,075 | $100,890 | $23,590 | $77,300 |
| 2015 | $5,874 | $100,890 | $23,590 | $77,300 |
| 2014 | $5,874 | $100,890 | $23,590 | $77,300 |
Source: Public Records
Map
Nearby Homes