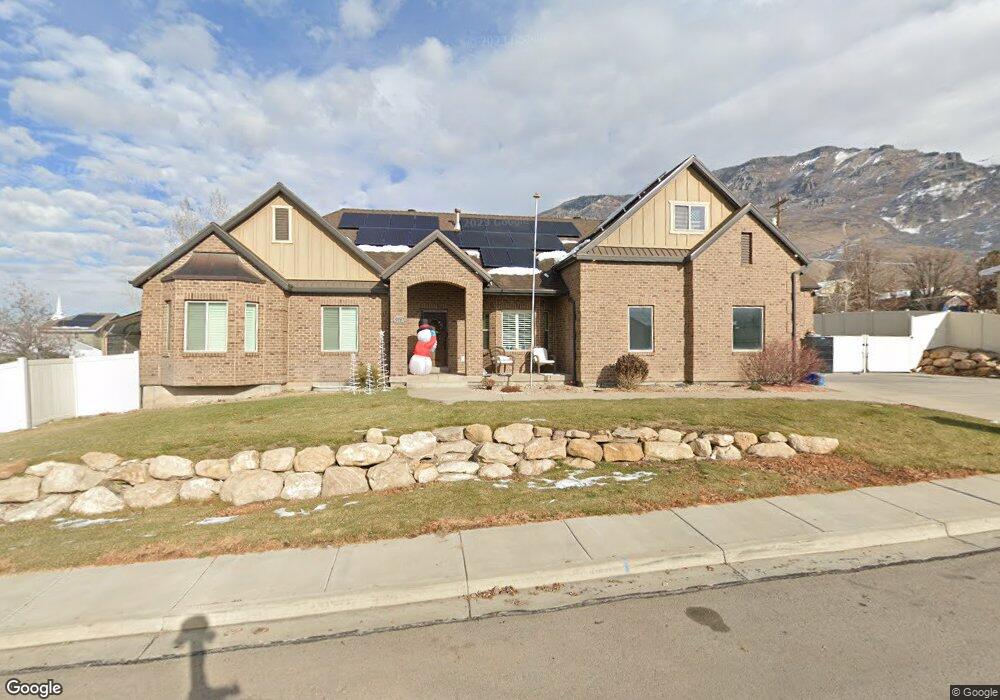
571 E 780 N Pleasant Grove, UT 84062
Estimated Value: $1,021,000 - $1,150,580
3
Beds
4
Baths
3,205
Sq Ft
$339/Sq Ft
Est. Value
About This Home
This home is located at 571 E 780 N, Pleasant Grove, UT 84062 and is currently estimated at $1,085,790, approximately $338 per square foot. 571 E 780 N is a home with nearby schools including Grovecrest Elementary School, Pleasant Grove Junior High School, and Pleasant Grove High School.
Ownership History
Date
Name
Owned For
Owner Type
Purchase Details
Closed on
Mar 11, 2012
Sold by
Southam Michael J
Bought by
Southam Michael J
Current Estimated Value
Home Financials for this Owner
Home Financials are based on the most recent Mortgage that was taken out on this home.
Original Mortgage
$316,000
Interest Rate
3.84%
Mortgage Type
New Conventional
Purchase Details
Closed on
Feb 3, 2009
Sold by
Southham Paul
Bought by
Southham Michael J
Home Financials for this Owner
Home Financials are based on the most recent Mortgage that was taken out on this home.
Original Mortgage
$316,550
Interest Rate
5.01%
Mortgage Type
Construction
Create a Home Valuation Report for This Property
The Home Valuation Report is an in-depth analysis detailing your home's value as well as a comparison with similar homes in the area
Home Values in the Area
Average Home Value in this Area
Purchase History
| Date | Buyer | Sale Price | Title Company |
|---|---|---|---|
| Southam Michael J | -- | None Available | |
| Southham Michael J | -- | Gt Title Services Spanish |
Source: Public Records
Mortgage History
| Date | Status | Borrower | Loan Amount |
|---|---|---|---|
| Closed | Southam Michael J | $316,000 | |
| Closed | Southham Michael J | $316,550 |
Source: Public Records
Tax History
| Year | Tax Paid | Tax Assessment Tax Assessment Total Assessment is a certain percentage of the fair market value that is determined by local assessors to be the total taxable value of land and additions on the property. | Land | Improvement |
|---|---|---|---|---|
| 2025 | $4,556 | $624,195 | -- | -- |
| 2024 | $4,556 | $531,685 | $0 | $0 |
| 2023 | $4,197 | $512,710 | $0 | $0 |
| 2022 | $3,864 | $469,700 | $0 | $0 |
| 2021 | $3,349 | $619,900 | $156,700 | $463,200 |
| 2020 | $3,092 | $561,000 | $139,900 | $421,100 |
| 2019 | $2,888 | $542,000 | $128,600 | $413,400 |
| 2018 | $2,990 | $530,600 | $117,200 | $413,400 |
| 2017 | $2,979 | $281,435 | $0 | $0 |
| 2016 | $2,670 | $243,485 | $0 | $0 |
| 2015 | $2,819 | $243,485 | $0 | $0 |
| 2014 | $2,831 | $242,220 | $0 | $0 |
Source: Public Records
Map
Nearby Homes
Your Personal Tour Guide
Ask me questions while you tour the home.