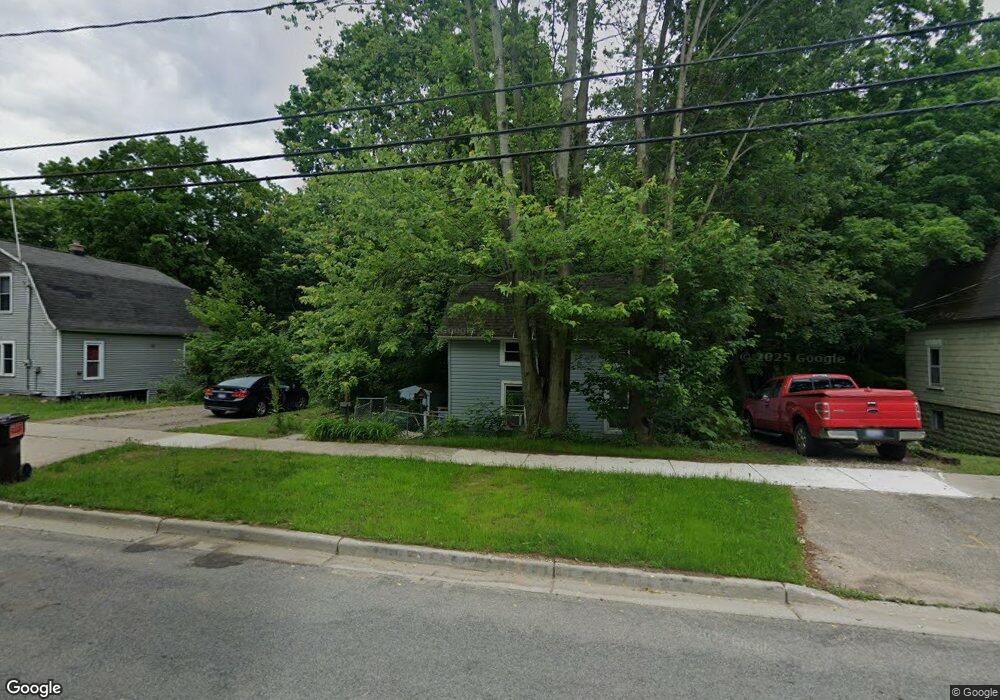
571 Ely St Allegan, MI 49010
Estimated Value: $81,149 - $213,000
Studio
--
Bath
--
Sq Ft
10,106
Sq Ft Lot
About This Home
This home is located at 571 Ely St, Allegan, MI 49010 and is currently estimated at $156,037. 571 Ely St is a home with nearby schools including West Ward Elementary School, L.E. White Middle School, and Allegan High School.
Ownership History
Date
Name
Owned For
Owner Type
Purchase Details
Closed on
Feb 21, 2020
Sold by
Murray Stephanie Kay Albaugh and Estate Of Logan Thunderland Al
Bought by
Hitchcock Alex
Current Estimated Value
Home Financials for this Owner
Home Financials are based on the most recent Mortgage that was taken out on this home.
Original Mortgage
$75,656
Outstanding Balance
$66,988
Interest Rate
3.6%
Mortgage Type
New Conventional
Estimated Equity
$89,049
Purchase Details
Closed on
Dec 21, 2017
Sold by
Bedell Kobi
Bought by
Allbaugh Logan
Home Financials for this Owner
Home Financials are based on the most recent Mortgage that was taken out on this home.
Original Mortgage
$63,050
Interest Rate
3.95%
Mortgage Type
New Conventional
Purchase Details
Closed on
Aug 2, 2017
Sold by
Peters Gregory Scot and Peters Jody
Bought by
Bedell Kobi
Purchase Details
Closed on
Jan 8, 2007
Sold by
City Of Allegan
Bought by
Peters Gregory and Peters Jody
Create a Home Valuation Report for This Property
The Home Valuation Report is an in-depth analysis detailing your home's value as well as a comparison with similar homes in the area
Home Values in the Area
Average Home Value in this Area
Purchase History
| Date | Buyer | Sale Price | Title Company |
|---|---|---|---|
| Hitchcock Alex | $74,900 | None Available | |
| Allbaugh Logan | $65,000 | None Available | |
| Bedell Kobi | $42,000 | Devon Title Agency | |
| Bedell Kobi | -- | Devon Title Agency | |
| Peters Gregory | $500 | None Available |
Source: Public Records
Mortgage History
| Date | Status | Borrower | Loan Amount |
|---|---|---|---|
| Open | Hitchcock Alex | $75,656 | |
| Previous Owner | Allbaugh Logan | $63,050 |
Source: Public Records
Tax History
| Year | Tax Paid | Tax Assessment Tax Assessment Total Assessment is a certain percentage of the fair market value that is determined by local assessors to be the total taxable value of land and additions on the property. | Land | Improvement |
|---|---|---|---|---|
| 2025 | $434 | $15,400 | $14,900 | $500 |
| 2024 | $395 | $13,400 | $12,900 | $500 |
| 2023 | $409 | $12,700 | $12,300 | $400 |
| 2022 | $395 | $10,600 | $10,200 | $400 |
| 2021 | $378 | $8,500 | $8,100 | $400 |
| 2020 | $306 | $7,800 | $7,400 | $400 |
| 2019 | $298 | $6,800 | $6,800 | $0 |
| 2018 | $265 | $6,600 | $6,600 | $0 |
| 2017 | $0 | $5,600 | $5,600 | $0 |
| 2016 | $0 | $4,600 | $4,600 | $0 |
| 2015 | -- | $4,600 | $4,600 | $0 |
| 2014 | -- | $4,600 | $4,600 | $0 |
| 2013 | $272 | $4,600 | $4,600 | $0 |
Source: Public Records
Map
Nearby Homes
Your Personal Tour Guide
Ask me questions while you tour the home.