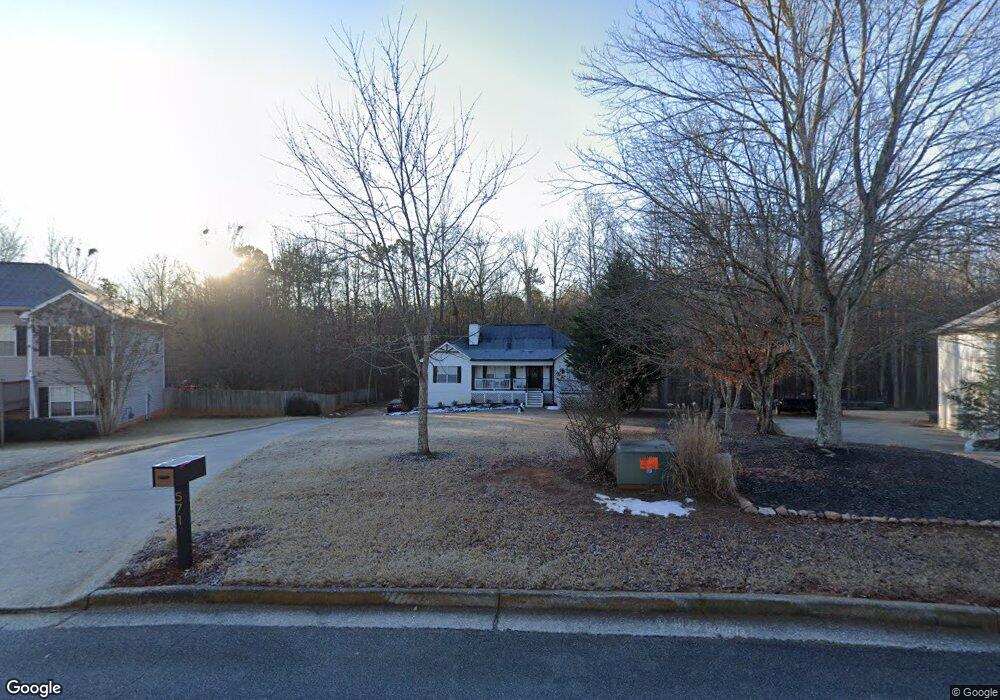
571 Hickory Lake Dr Acworth, GA 30101
Cedarcrest NeighborhoodEstimated Value: $362,000 - $417,000
3
Beds
2
Baths
1,796
Sq Ft
$212/Sq Ft
Est. Value
About This Home
This home is located at 571 Hickory Lake Dr, Acworth, GA 30101 and is currently estimated at $381,433, approximately $212 per square foot. 571 Hickory Lake Dr is a home located in Paulding County with nearby schools including Roland W. Russom Elementary School, East Paulding Middle School, and North Paulding High School.
Ownership History
Date
Name
Owned For
Owner Type
Purchase Details
Closed on
Sep 30, 2024
Sold by
Hutchings Robert M
Bought by
Hutchings Mariah Nicole and Hutchings Robert M
Current Estimated Value
Home Financials for this Owner
Home Financials are based on the most recent Mortgage that was taken out on this home.
Original Mortgage
$339,845
Outstanding Balance
$336,272
Interest Rate
6.35%
Mortgage Type
FHA
Estimated Equity
$45,161
Purchase Details
Closed on
Aug 29, 2023
Sold by
Hutchings Shirley L
Bought by
Hutchings Robert M and Hutchings Shirley L
Purchase Details
Closed on
Apr 30, 2002
Sold by
Value Plus Inc
Bought by
Hutchings Shirley L
Home Financials for this Owner
Home Financials are based on the most recent Mortgage that was taken out on this home.
Original Mortgage
$111,750
Interest Rate
6.77%
Mortgage Type
New Conventional
Create a Home Valuation Report for This Property
The Home Valuation Report is an in-depth analysis detailing your home's value as well as a comparison with similar homes in the area
Home Values in the Area
Average Home Value in this Area
Purchase History
| Date | Buyer | Sale Price | Title Company |
|---|---|---|---|
| Hutchings Mariah Nicole | -- | -- | |
| Hutchings Robert M | -- | -- | |
| Hutchings Shirley L | $139,800 | -- |
Source: Public Records
Mortgage History
| Date | Status | Borrower | Loan Amount |
|---|---|---|---|
| Open | Hutchings Mariah Nicole | $339,845 | |
| Previous Owner | Hutchings Shirley L | $111,750 |
Source: Public Records
Tax History Compared to Growth
Tax History
| Year | Tax Paid | Tax Assessment Tax Assessment Total Assessment is a certain percentage of the fair market value that is determined by local assessors to be the total taxable value of land and additions on the property. | Land | Improvement |
|---|---|---|---|---|
| 2024 | $3,505 | $144,156 | $16,000 | $128,156 |
| 2023 | $3,817 | $148,932 | $16,000 | $132,932 |
| 2022 | $3,193 | $124,344 | $16,000 | $108,344 |
| 2021 | $2,864 | $100,428 | $16,000 | $84,428 |
| 2020 | $2,606 | $89,584 | $16,000 | $73,584 |
| 2019 | $2,706 | $91,652 | $16,000 | $75,652 |
| 2018 | $2,415 | $82,016 | $16,000 | $66,016 |
| 2017 | $2,332 | $78,192 | $16,000 | $62,192 |
| 2016 | $1,820 | $62,040 | $16,000 | $46,040 |
| 2015 | $1,873 | $62,704 | $16,000 | $46,704 |
| 2014 | $1,724 | $56,464 | $16,000 | $40,464 |
| 2013 | -- | $55,960 | $16,000 | $39,960 |
Source: Public Records
Map
Nearby Homes
- 561 Hickory Lake Dr
- 589 Hickory Lake Dr
- 551 Hickory Lake Dr
- 609 Hickory Lake Dr
- 556 Hickory Lake Dr
- 539 Hickory Lake Dr
- 600 Hickory Lake Dr
- 629 Hickory Lake Dr
- 618 Hickory Lake Dr
- 519 Hickory Lake Dr
- 510 Hickory Lake Dr
- 659 Hickory Lake Dr
- 43 Hickory Brook Ln
- 640 Hickory Lake Dr
- 65 Hickory Brook Ln
- 669 Hickory Lake Dr
- 662 Hickory Lake Dr
- 84 Hickory Brook Ln
- 471 Hickory Lake Dr
- 0 Hickory Brook Ln Unit 8575642