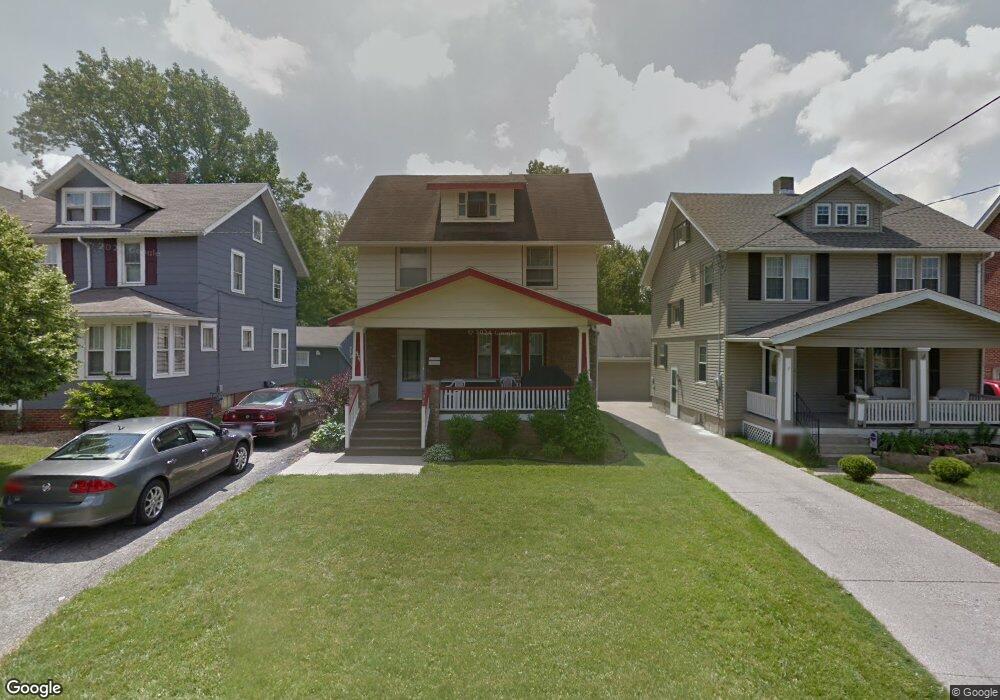
571 Maple St Mansfield, OH 44906
Estimated Value: $134,000 - $152,000
3
Beds
2
Baths
1,456
Sq Ft
$98/Sq Ft
Est. Value
About This Home
This home is located at 571 Maple St, Mansfield, OH 44906 and is currently estimated at $143,070, approximately $98 per square foot. 571 Maple St is a home located in Richland County with nearby schools including Goal Digital Academy, Discovery School, and St. Peter's Elementary/Montessori School.
Ownership History
Date
Name
Owned For
Owner Type
Purchase Details
Closed on
Aug 11, 2003
Sold by
Jordan John S and Jordan Ann L
Bought by
Butts Ursula D
Current Estimated Value
Purchase Details
Closed on
Oct 23, 2001
Sold by
Henrich Charles J
Bought by
Jordan John S and Jordan Ann L
Home Financials for this Owner
Home Financials are based on the most recent Mortgage that was taken out on this home.
Original Mortgage
$70,100
Interest Rate
6.92%
Mortgage Type
New Conventional
Create a Home Valuation Report for This Property
The Home Valuation Report is an in-depth analysis detailing your home's value as well as a comparison with similar homes in the area
Home Values in the Area
Average Home Value in this Area
Purchase History
| Date | Buyer | Sale Price | Title Company |
|---|---|---|---|
| Butts Ursula D | -- | -- | |
| Jordan John S | $82,500 | -- |
Source: Public Records
Mortgage History
| Date | Status | Borrower | Loan Amount |
|---|---|---|---|
| Previous Owner | Jordan John S | $70,100 |
Source: Public Records
Tax History
| Year | Tax Paid | Tax Assessment Tax Assessment Total Assessment is a certain percentage of the fair market value that is determined by local assessors to be the total taxable value of land and additions on the property. | Land | Improvement |
|---|---|---|---|---|
| 2024 | $1,417 | $30,950 | $3,300 | $27,650 |
| 2023 | $1,449 | $30,950 | $3,300 | $27,650 |
| 2022 | $1,249 | $22,360 | $2,840 | $19,520 |
| 2021 | $1,258 | $22,360 | $2,840 | $19,520 |
| 2020 | $1,286 | $22,360 | $2,840 | $19,520 |
| 2019 | $1,426 | $22,360 | $2,840 | $19,520 |
| 2018 | $1,406 | $22,360 | $2,840 | $19,520 |
| 2017 | $1,368 | $22,360 | $2,840 | $19,520 |
| 2016 | $1,351 | $21,400 | $3,910 | $17,490 |
| 2015 | $1,290 | $21,400 | $3,910 | $17,490 |
| 2014 | $1,273 | $21,400 | $3,910 | $17,490 |
| 2012 | $485 | $21,390 | $4,110 | $17,280 |
Source: Public Records
Map
Nearby Homes
- 189 Westwood Ave
- 133 Stewart Ave S
- 116 Stewart Ave S
- 126 Dawson Ave
- 108 Stewart Ave S
- 455 Marion Ave
- 71 Dawson Ave
- 24 Stewart Ave S
- 31 Parkwood Blvd
- 679 Coleman Rd
- 686 Barnard Ave
- 158 Vennum Ave
- 143 Fairlawn Ave
- 135 Fairlawn Ave
- 129 Fairlawn Ave
- 31 Bartley Ave
- 616 Cline Ave
- 30 Douglas Ave
- 51 Lind Ave
- 183 Carpenter Rd
- 575 Maple St
- 567 Maple St
- 171 Westwood Ave
- 171 Westwood Ave
- 579 Maple St
- 563 Maple St
- 583 Maple St
- 555 Maple St
- 151 Stewart Ave S
- 148 Stewart Ave S
- 179 Westwood Ave
- 180 Dawson Ave
- 556 Maple St
- 556 1/2 Maple St
- 146 Stewart Ave S
- 145 Stewart Ave S
- 186 Dawson Ave
- 593 Maple St
- 593 Maple St Unit Lower Unit
- 142 Stewart Ave S
Your Personal Tour Guide
Ask me questions while you tour the home.