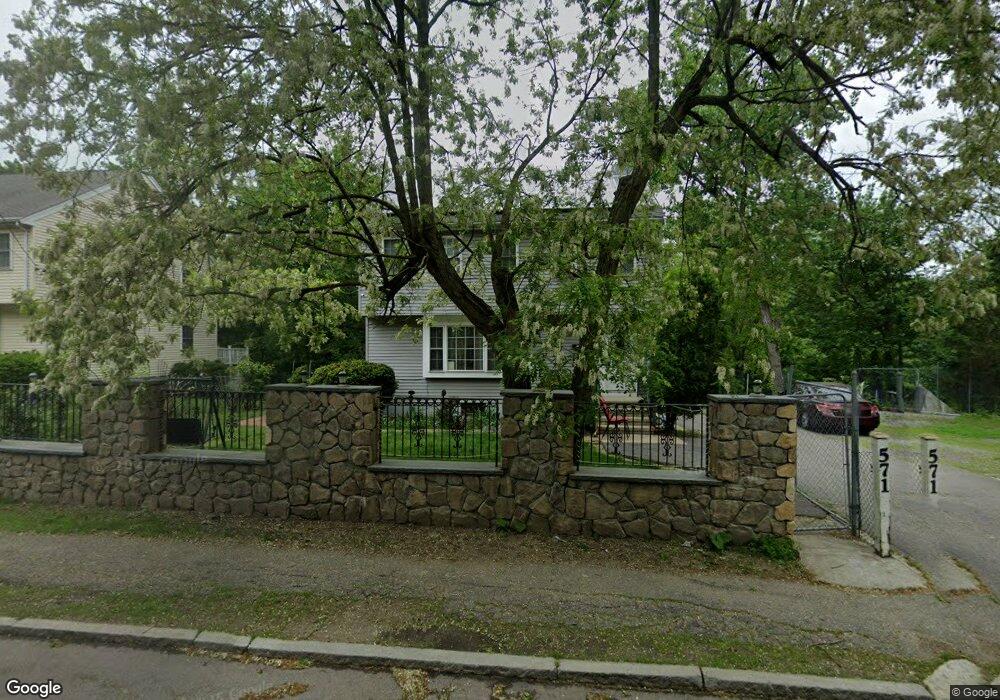
571 Truman Hwy Hyde Park, MA 02136
Hyde Park NeighborhoodEstimated Value: $701,000 - $887,000
4
Beds
3
Baths
1,920
Sq Ft
$432/Sq Ft
Est. Value
About This Home
This home is located at 571 Truman Hwy, Hyde Park, MA 02136 and is currently estimated at $829,696, approximately $432 per square foot. 571 Truman Hwy is a home located in Suffolk County with nearby schools including Boston Renaissance Charter Public School, Boston Preparatory Charter Public School, and New Beginnings Academy.
Ownership History
Date
Name
Owned For
Owner Type
Purchase Details
Closed on
Sep 20, 2024
Sold by
Aguilar Rodolfo N and Aguilar Dora
Bought by
571 Truman Highway Rt and Herrera
Current Estimated Value
Purchase Details
Closed on
Mar 20, 2018
Sold by
Aguilar Rodolfo N
Bought by
Aguilar Rodolfo N and Aguilar Dora
Purchase Details
Closed on
Jul 18, 2000
Sold by
Truman Bannon Rt
Bought by
Aguilar Rodolfo N
Create a Home Valuation Report for This Property
The Home Valuation Report is an in-depth analysis detailing your home's value as well as a comparison with similar homes in the area
Home Values in the Area
Average Home Value in this Area
Purchase History
| Date | Buyer | Sale Price | Title Company |
|---|---|---|---|
| 571 Truman Highway Rt | -- | None Available | |
| 571 Truman Highway Rt | -- | None Available | |
| Aguilar Rodolfo N | -- | -- | |
| Aguilar Rodolfo N | $267,000 | -- | |
| Aguilar Rodolfo N | -- | -- | |
| Aguilar Rodolfo N | $267,000 | -- |
Source: Public Records
Mortgage History
| Date | Status | Borrower | Loan Amount |
|---|---|---|---|
| Previous Owner | Aguilar Rodolfo N | $100,000 | |
| Previous Owner | Aguilar Rodolfo N | $175,000 | |
| Previous Owner | Aguilar Rodolfo N | $174,000 |
Source: Public Records
Tax History Compared to Growth
Tax History
| Year | Tax Paid | Tax Assessment Tax Assessment Total Assessment is a certain percentage of the fair market value that is determined by local assessors to be the total taxable value of land and additions on the property. | Land | Improvement |
|---|---|---|---|---|
| 2025 | $8,883 | $767,100 | $222,500 | $544,600 |
| 2024 | $8,297 | $761,200 | $219,100 | $542,100 |
| 2023 | $8,175 | $761,200 | $219,100 | $542,100 |
| 2022 | $7,670 | $705,000 | $202,900 | $502,100 |
| 2021 | $6,790 | $636,400 | $187,900 | $448,500 |
| 2020 | $5,796 | $548,900 | $174,500 | $374,400 |
| 2019 | $5,407 | $513,000 | $142,800 | $370,200 |
| 2018 | $5,272 | $503,100 | $142,800 | $360,300 |
| 2017 | $5,328 | $503,100 | $142,800 | $360,300 |
| 2016 | $4,941 | $449,200 | $142,800 | $306,400 |
| 2015 | $5,258 | $434,200 | $121,700 | $312,500 |
| 2014 | $5,355 | $425,700 | $121,700 | $304,000 |
Source: Public Records
Map
Nearby Homes