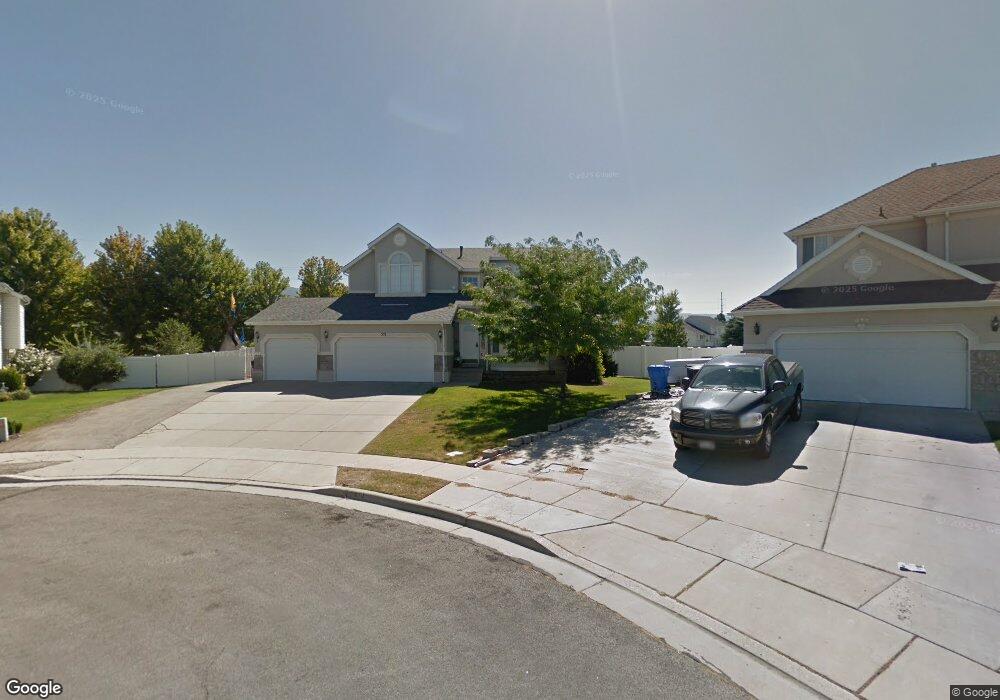
571 W 1225 N West Bountiful, UT 84087
Estimated Value: $556,000 - $730,000
3
Beds
3
Baths
3,010
Sq Ft
$215/Sq Ft
Est. Value
About This Home
This home is located at 571 W 1225 N, West Bountiful, UT 84087 and is currently estimated at $646,459, approximately $214 per square foot. 571 W 1225 N is a home located in Davis County with nearby schools including West Bountiful Elementary School, Bountiful Junior High School, and Viewmont High School.
Ownership History
Date
Name
Owned For
Owner Type
Purchase Details
Closed on
Apr 6, 2018
Sold by
Bubert Theodore and Bubert Catherine
Bought by
Wahsatch Investmenst Llc
Current Estimated Value
Home Financials for this Owner
Home Financials are based on the most recent Mortgage that was taken out on this home.
Original Mortgage
$254,800
Outstanding Balance
$218,447
Interest Rate
4.4%
Mortgage Type
New Conventional
Estimated Equity
$428,013
Purchase Details
Closed on
Nov 22, 2006
Sold by
Olson Steven G and Olson Sharlee W
Bought by
Jensen David F and Jensen Sally J
Purchase Details
Closed on
May 22, 1998
Sold by
Gmw Development Inc
Bought by
Olson Steven G and Olson Sharlee W
Home Financials for this Owner
Home Financials are based on the most recent Mortgage that was taken out on this home.
Original Mortgage
$205,700
Interest Rate
7.07%
Create a Home Valuation Report for This Property
The Home Valuation Report is an in-depth analysis detailing your home's value as well as a comparison with similar homes in the area
Home Values in the Area
Average Home Value in this Area
Purchase History
| Date | Buyer | Sale Price | Title Company |
|---|---|---|---|
| Wahsatch Investmenst Llc | -- | Us Title | |
| Bubert Theodore | -- | Us Title | |
| Jensen David F | -- | Backman Title Services | |
| Olson Steven G | -- | Bonneville Title Company |
Source: Public Records
Mortgage History
| Date | Status | Borrower | Loan Amount |
|---|---|---|---|
| Open | Bubert Theodore | $254,800 | |
| Previous Owner | Olson Steven G | $205,700 |
Source: Public Records
Tax History Compared to Growth
Tax History
| Year | Tax Paid | Tax Assessment Tax Assessment Total Assessment is a certain percentage of the fair market value that is determined by local assessors to be the total taxable value of land and additions on the property. | Land | Improvement |
|---|---|---|---|---|
| 2025 | $3,775 | $327,800 | $164,810 | $162,990 |
| 2024 | $3,523 | $312,949 | $136,058 | $176,891 |
| 2023 | $3,395 | $304,150 | $139,491 | $164,659 |
| 2022 | $3,506 | $582,000 | $226,643 | $355,357 |
| 2021 | $3,147 | $440,000 | $173,876 | $266,124 |
| 2020 | $2,784 | $384,000 | $156,828 | $227,172 |
| 2019 | $2,698 | $368,000 | $154,745 | $213,255 |
| 2018 | $2,546 | $341,000 | $149,728 | $191,272 |
| 2016 | $2,239 | $162,910 | $44,409 | $118,501 |
| 2015 | $2,315 | $152,460 | $44,409 | $108,051 |
| 2014 | $2,002 | $133,644 | $44,409 | $89,235 |
| 2013 | -- | $123,912 | $46,473 | $77,439 |
Source: Public Records
Map
Nearby Homes
- 366 W 1000 N
- Lincoln Farmhouse Plan at Belmont Farms
- Belmont Traditional Plan at Belmont Farms
- Hampton Traditional Plan at Belmont Farms
- 637 W 1600 N
- 790 N 500 W
- 825 W 1320 N
- 1503 N 300 W
- 235 W 1400 N
- 1194 N 200 W
- 1410 N 200 W
- 1260 N 200 W
- 184 Park Shadows Cir
- 1552 N 200 W
- 553 N 200 W
- 810 Park Shadows Cir
- 340 N 500 W Unit 204
- 399 W 400 N Unit 47
- 499 N 200 W Unit 30
- 499 N 200 W Unit 19