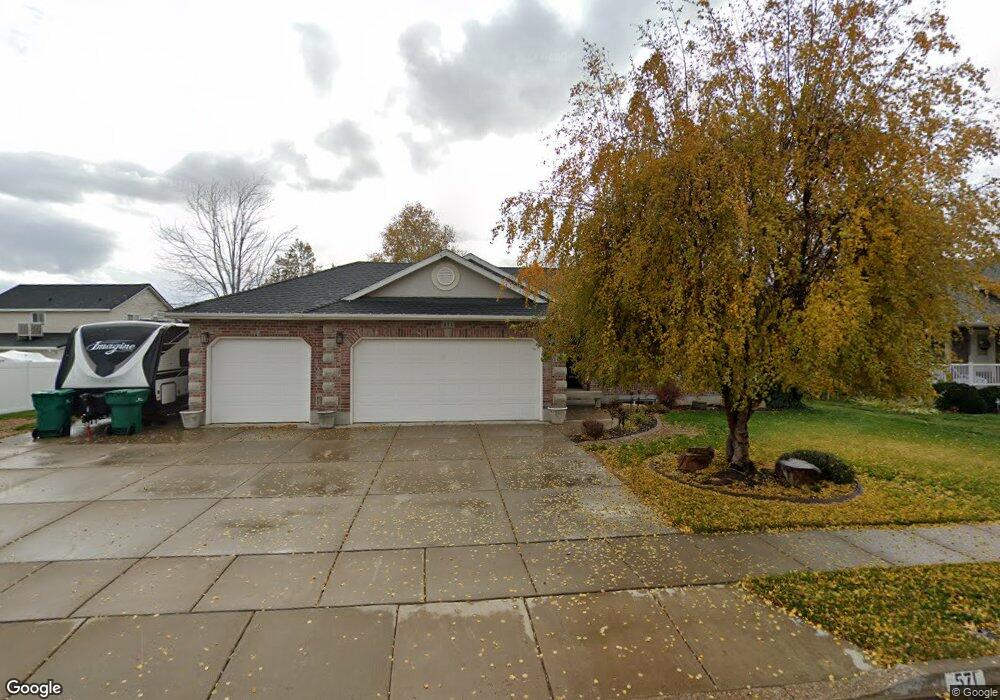
571 W 225 S Layton, UT 84041
Estimated Value: $451,000 - $646,801
4
Beds
3
Baths
3,231
Sq Ft
$178/Sq Ft
Est. Value
About This Home
This home is located at 571 W 225 S, Layton, UT 84041 and is currently estimated at $576,450, approximately $178 per square foot. 571 W 225 S is a home located in Davis County with nearby schools including Layton Elementary School, Fairfield Junior High School, and Layton High School.
Ownership History
Date
Name
Owned For
Owner Type
Purchase Details
Closed on
Sep 12, 2024
Sold by
Eikenbary Ron and Eikenbary Terri
Bought by
Eikenbary Ron
Current Estimated Value
Home Financials for this Owner
Home Financials are based on the most recent Mortgage that was taken out on this home.
Original Mortgage
$268,750
Outstanding Balance
$265,626
Interest Rate
6.73%
Mortgage Type
New Conventional
Estimated Equity
$310,824
Purchase Details
Closed on
Jun 19, 2009
Sold by
Eikenbary Terri
Bought by
Eikenbary Ron and Eikenbary Terri
Home Financials for this Owner
Home Financials are based on the most recent Mortgage that was taken out on this home.
Original Mortgage
$220,000
Interest Rate
4.82%
Mortgage Type
Purchase Money Mortgage
Purchase Details
Closed on
Nov 10, 1999
Sold by
Ed Green Construction Inc
Bought by
Mcclurg David L and Mcclurg Leslie J
Home Financials for this Owner
Home Financials are based on the most recent Mortgage that was taken out on this home.
Original Mortgage
$148,000
Interest Rate
7.68%
Create a Home Valuation Report for This Property
The Home Valuation Report is an in-depth analysis detailing your home's value as well as a comparison with similar homes in the area
Home Values in the Area
Average Home Value in this Area
Purchase History
| Date | Buyer | Sale Price | Title Company |
|---|---|---|---|
| Eikenbary Ron | -- | Silver Leaf Title | |
| Eikenbary Ron | -- | First American Title | |
| Eikenbary Terri | -- | First American Title | |
| Mcclurg David L | -- | Security Title Company |
Source: Public Records
Mortgage History
| Date | Status | Borrower | Loan Amount |
|---|---|---|---|
| Open | Eikenbary Ron | $268,750 | |
| Previous Owner | Eikenbary Terri | $220,000 | |
| Previous Owner | Mcclurg David L | $148,000 |
Source: Public Records
Tax History
| Year | Tax Paid | Tax Assessment Tax Assessment Total Assessment is a certain percentage of the fair market value that is determined by local assessors to be the total taxable value of land and additions on the property. | Land | Improvement |
|---|---|---|---|---|
| 2025 | $2,997 | $314,600 | $123,297 | $191,303 |
| 2024 | $2,845 | $300,850 | $132,426 | $168,424 |
| 2023 | $2,844 | $530,000 | $139,091 | $390,909 |
| 2022 | $3,070 | $310,750 | $81,564 | $229,186 |
| 2021 | $2,676 | $404,000 | $122,332 | $281,668 |
| 2020 | $2,431 | $352,000 | $104,351 | $247,649 |
| 2019 | $2,348 | $333,000 | $103,585 | $229,415 |
| 2018 | $2,311 | $329,000 | $91,234 | $237,766 |
| 2016 | $2,135 | $156,860 | $37,633 | $119,227 |
| 2015 | $2,156 | $150,315 | $37,633 | $112,682 |
| 2014 | $2,026 | $144,452 | $37,633 | $106,819 |
| 2013 | -- | $141,382 | $27,569 | $113,813 |
Source: Public Records
Map
Nearby Homes
Your Personal Tour Guide
Ask me questions while you tour the home.