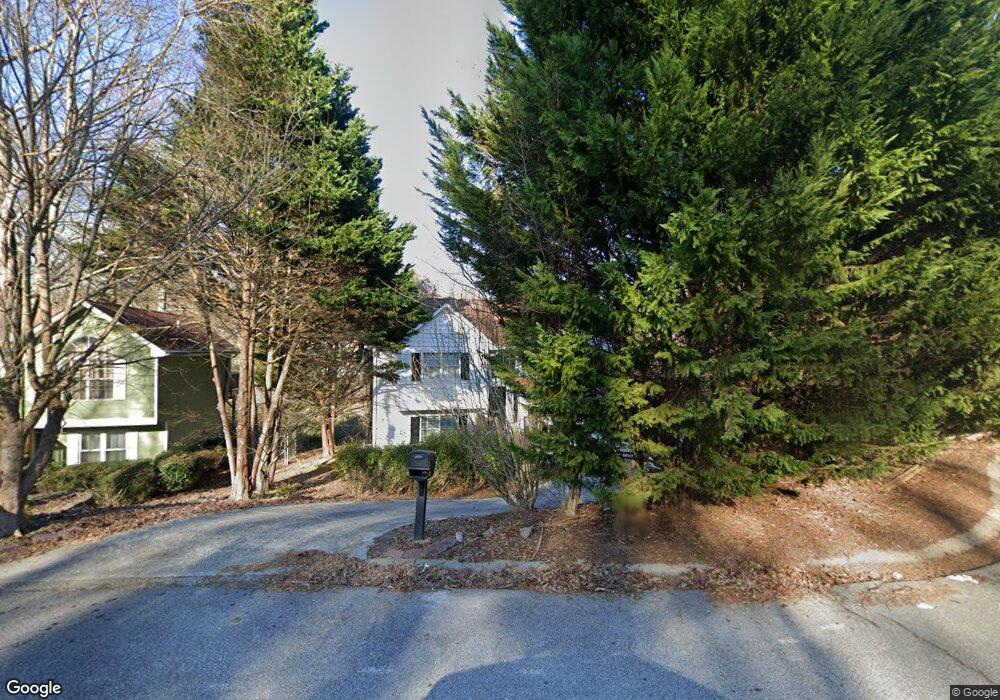
5710 Cardigan Trace NE Sugar Hill, GA 30518
Estimated Value: $276,000 - $281,000
3
Beds
2
Baths
1,336
Sq Ft
$209/Sq Ft
Est. Value
About This Home
This home is located at 5710 Cardigan Trace NE, Sugar Hill, GA 30518 and is currently estimated at $279,370, approximately $209 per square foot. 5710 Cardigan Trace NE is a home located in Gwinnett County with nearby schools including Sycamore Elementary School, Lanier Middle School, and Lanier High School.
Ownership History
Date
Name
Owned For
Owner Type
Purchase Details
Closed on
Sep 25, 2025
Sold by
2018-3 Ih Borrower Lp
Bought by
Dgs Residential Properties Llc
Current Estimated Value
Home Financials for this Owner
Home Financials are based on the most recent Mortgage that was taken out on this home.
Original Mortgage
$262,500
Outstanding Balance
$241,275
Interest Rate
6.56%
Mortgage Type
Commercial
Estimated Equity
$38,095
Purchase Details
Closed on
Jun 25, 2015
Sold by
Ih2 Property Georgia Lp
Bought by
2015 3 Ih2 Borrower Lp
Purchase Details
Closed on
Apr 2, 2013
Sold by
Cooper Randy C
Bought by
Ih2 Property Georgia Lp
Purchase Details
Closed on
Aug 26, 1996
Sold by
Camel Inc
Bought by
Cooper Randy C Linda L
Create a Home Valuation Report for This Property
The Home Valuation Report is an in-depth analysis detailing your home's value as well as a comparison with similar homes in the area
Home Values in the Area
Average Home Value in this Area
Purchase History
| Date | Buyer | Sale Price | Title Company |
|---|---|---|---|
| Dgs Residential Properties Llc | $280,000 | -- | |
| 2015 3 Ih2 Borrower Lp | -- | -- | |
| Ih2 Property Georgia Lp | $124,000 | -- | |
| Cooper Randy C Linda L | $88,000 | -- |
Source: Public Records
Mortgage History
| Date | Status | Borrower | Loan Amount |
|---|---|---|---|
| Open | Dgs Residential Properties Llc | $262,500 | |
| Closed | Cooper Randy C Linda L | $0 |
Source: Public Records
Tax History Compared to Growth
Tax History
| Year | Tax Paid | Tax Assessment Tax Assessment Total Assessment is a certain percentage of the fair market value that is determined by local assessors to be the total taxable value of land and additions on the property. | Land | Improvement |
|---|---|---|---|---|
| 2025 | $432 | $113,080 | $28,800 | $84,280 |
| 2024 | $3,947 | $113,080 | $28,800 | $84,280 |
| 2023 | $3,947 | $104,760 | $26,000 | $78,760 |
| 2022 | $2,408 | $68,800 | $14,400 | $54,400 |
| 2021 | $2,456 | $68,800 | $14,400 | $54,400 |
| 2020 | $2,170 | $71,960 | $14,400 | $57,560 |
| 2019 | $2,095 | $53,680 | $12,000 | $41,680 |
| 2018 | $2,103 | $53,680 | $12,000 | $41,680 |
| 2016 | $1,849 | $47,120 | $12,000 | $35,120 |
| 2015 | $1,629 | $40,920 | $8,000 | $32,920 |
| 2014 | -- | $40,920 | $8,000 | $32,920 |
Source: Public Records
Map
Nearby Homes
- 5757 Riverside Dr Unit 2
- 1114 Danube Trail
- 5660 Winter Bluff Way
- 5689 Winter Bluff Way
- 5680 Princeton Oaks Dr
- 5650 Princeton Oaks Dr
- 1275 Riverside Rd
- 1541 Autumn Wood Trail
- 1150 Sycamore Creek Trail
- 5800 S Richland Creek Rd
- 1025 Hunters Oak Trail
- 1438 Autumn Wood Trail
- 5880 April Dr Unit 1
- 5683 Riverside Walk Dr
- 1230 Primrose Park Rd
- 978 Sugar Vista Cir
- 965 Sugar Meadow Dr
- 5710 Cardigan Trace
- 5710 Cardigan Trace Unit 5710
- 5700 Cardigan Trace
- 5720 Cardigan Trace
- 5690 Cardigan Trace
- 5627 Riverside Dr
- 5724 Cardigan Trace
- 5695 Cardigan Trace Unit 1
- 5705 Cardigan Trace Unit 1
- 5617 Riverside Dr
- 5680 Cardigan Trace
- 5637 Riverside Dr
- 5715 Cardigan Trace
- 5675 Cardigan Trace
- 5647 Riverside Dr
- 5670 Cardigan Trace Unit 1
- 5657 Riverside Dr Unit 94
- 5657 Riverside Dr
- 5657 Riverside Dr Unit 5657
- 5665 Cardigan Trace Unit 1