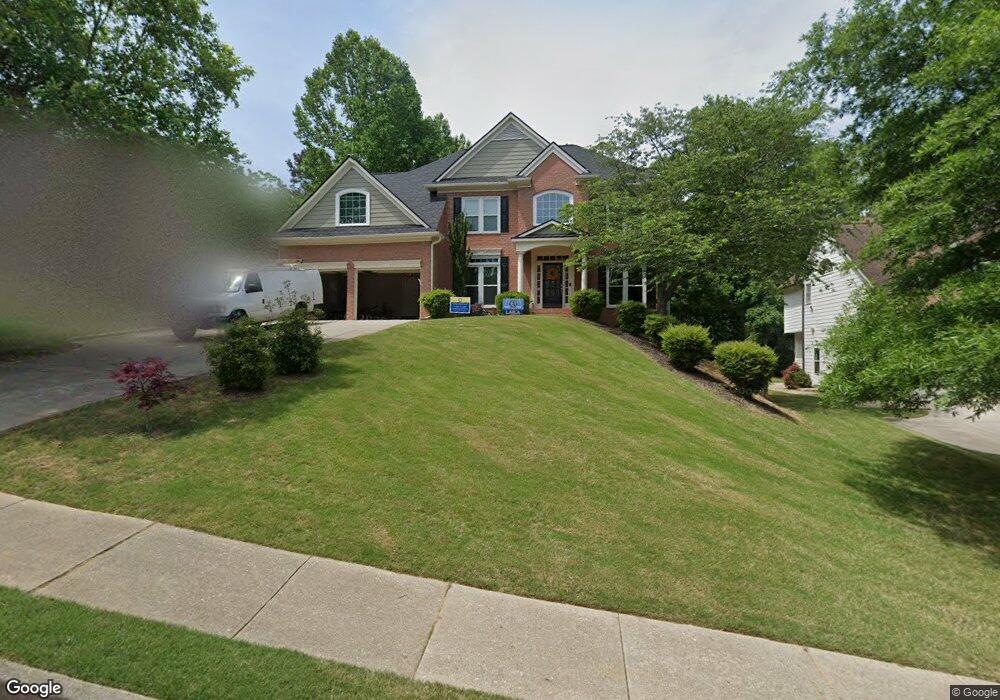
5710 Devonshire Way Cumming, GA 30040
Estimated Value: $655,807 - $760,000
4
Beds
4
Baths
3,148
Sq Ft
$225/Sq Ft
Est. Value
About This Home
This home is located at 5710 Devonshire Way, Cumming, GA 30040 and is currently estimated at $708,202, approximately $224 per square foot. 5710 Devonshire Way is a home located in Forsyth County with nearby schools including Vickery Creek Middle School, Forsyth Central High School, and Alpharetta Tamil School.
Ownership History
Date
Name
Owned For
Owner Type
Purchase Details
Closed on
Feb 27, 2017
Sold by
Lamb Joseph M
Bought by
Taziwa Gilbert K
Current Estimated Value
Home Financials for this Owner
Home Financials are based on the most recent Mortgage that was taken out on this home.
Original Mortgage
$339,241
Outstanding Balance
$277,972
Interest Rate
3.75%
Mortgage Type
FHA
Estimated Equity
$430,230
Purchase Details
Closed on
Jan 11, 2002
Sold by
Lamb Joseph M
Bought by
Lamb Joseph M and Lamb Virginia M
Home Financials for this Owner
Home Financials are based on the most recent Mortgage that was taken out on this home.
Original Mortgage
$248,000
Interest Rate
7.08%
Mortgage Type
New Conventional
Purchase Details
Closed on
Apr 27, 2001
Sold by
John Wieland Homes & Neighs Inc
Bought by
Lamb Joseph M and Lamb Virginia M
Home Financials for this Owner
Home Financials are based on the most recent Mortgage that was taken out on this home.
Original Mortgage
$248,650
Interest Rate
6.9%
Mortgage Type
New Conventional
Create a Home Valuation Report for This Property
The Home Valuation Report is an in-depth analysis detailing your home's value as well as a comparison with similar homes in the area
Home Values in the Area
Average Home Value in this Area
Purchase History
| Date | Buyer | Sale Price | Title Company |
|---|---|---|---|
| Taziwa Gilbert K | $345,500 | -- | |
| Lamb Joseph M | -- | -- | |
| Lamb Joseph M | $293,700 | -- |
Source: Public Records
Mortgage History
| Date | Status | Borrower | Loan Amount |
|---|---|---|---|
| Open | Taziwa Gilbert K | $339,241 | |
| Previous Owner | Lamb Joseph M | $248,000 | |
| Previous Owner | Lamb Joseph M | $248,650 |
Source: Public Records
Tax History
| Year | Tax Paid | Tax Assessment Tax Assessment Total Assessment is a certain percentage of the fair market value that is determined by local assessors to be the total taxable value of land and additions on the property. | Land | Improvement |
|---|---|---|---|---|
| 2025 | $6,221 | $259,028 | $60,000 | $199,028 |
| 2024 | $6,221 | $253,708 | $60,000 | $193,708 |
| 2023 | $6,457 | $262,336 | $60,000 | $202,336 |
Source: Public Records
Map
Nearby Homes
- 6770 Waveland Dr
- 5960 Weddington Dr
- 5320 Brookglen Ct
- 5875 Weddington Dr
- 6250 Turfway Dr
- 6525 Cold Stream Dr
- 5725 Weddington Dr
- 6160 Turfway Dr
- 4770 Wayt Farm Overlook
- 5695 Carrington Place
- 6140 Turfway Dr
- 6340 Waveland Dr Unit 1B
- 5335 Kings Common Way
- 5330 Kings Hill Dr
- 6030 Ellington Cove
- 5850 Bentley Way
- 6165 Bennett Pkwy
- 5702 Castleberry Rd
- 5485 Sandstone Ct
- 5692 Castleberry Rd
- 5710 Devonshire Way Unit N/a
- 5710 Devonshire Way Unit 5710
- 5710 Devonshire Way
- 5710 Devonshire Way Unit 1
- 5690 Devonshire Way
- 5730 Devonshire Way
- 5680 Devonshire Way
- 5980 Worthington Ct Unit 4
- 5740 Devonshire Way
- 5970 Worthington Ct
- 5990 Worthington Ct
- 5695 Devonshire Way
- 5725 Devonshire Way
- 5715 Devonshire Way
- 5670 Devonshire Way
- 5960 Worthington Ct
- 5685 Devonshire Way
- 5745 Devonshire Way
- 5675 Devonshire Way
- 5995 Worthington Ct
Your Personal Tour Guide
Ask me questions while you tour the home.