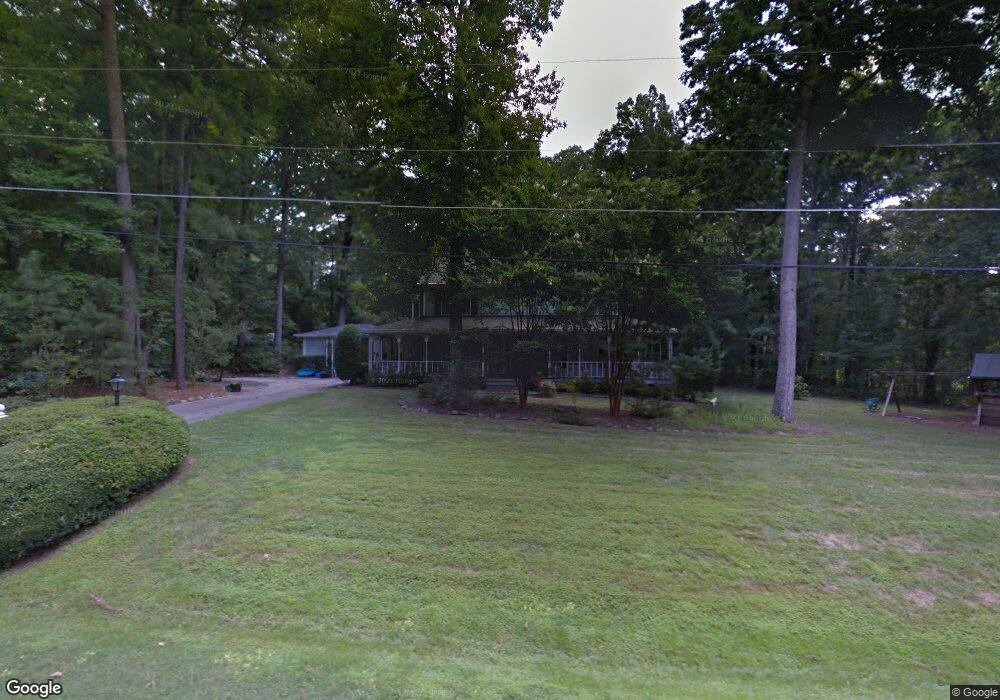
5710 Kith Place Durham, NC 27712
North Durham NeighborhoodEstimated Value: $471,291 - $513,000
4
Beds
3
Baths
2,557
Sq Ft
$194/Sq Ft
Est. Value
About This Home
This home is located at 5710 Kith Place, Durham, NC 27712 and is currently estimated at $495,573, approximately $193 per square foot. 5710 Kith Place is a home located in Durham County with nearby schools including Eno Valley Elementary, George L Carrington Middle, and Northern High School.
Ownership History
Date
Name
Owned For
Owner Type
Purchase Details
Closed on
Apr 7, 2014
Sold by
Waters Timothy G and Caspar Rachel A
Bought by
Caspar Rachel A
Current Estimated Value
Home Financials for this Owner
Home Financials are based on the most recent Mortgage that was taken out on this home.
Original Mortgage
$164,900
Outstanding Balance
$47,334
Interest Rate
3.4%
Mortgage Type
New Conventional
Estimated Equity
$448,239
Purchase Details
Closed on
May 28, 1998
Sold by
Reynolds Harry L
Bought by
Waters Timothy G and Casper Rachel A
Home Financials for this Owner
Home Financials are based on the most recent Mortgage that was taken out on this home.
Original Mortgage
$161,600
Interest Rate
7.11%
Mortgage Type
Purchase Money Mortgage
Create a Home Valuation Report for This Property
The Home Valuation Report is an in-depth analysis detailing your home's value as well as a comparison with similar homes in the area
Home Values in the Area
Average Home Value in this Area
Purchase History
| Date | Buyer | Sale Price | Title Company |
|---|---|---|---|
| Caspar Rachel A | -- | None Available | |
| Waters Timothy G | -- | -- |
Source: Public Records
Mortgage History
| Date | Status | Borrower | Loan Amount |
|---|---|---|---|
| Open | Caspar Rachel A | $164,900 | |
| Closed | Waters Timothy G | $161,600 | |
| Closed | Waters Timothy G | $20,200 |
Source: Public Records
Tax History
| Year | Tax Paid | Tax Assessment Tax Assessment Total Assessment is a certain percentage of the fair market value that is determined by local assessors to be the total taxable value of land and additions on the property. | Land | Improvement |
|---|---|---|---|---|
| 2025 | $3,040 | $427,662 | $86,000 | $341,662 |
| 2024 | $2,904 | $287,326 | $42,875 | $244,451 |
| 2023 | $2,754 | $287,326 | $42,875 | $244,451 |
| 2022 | $2,648 | $287,326 | $42,875 | $244,451 |
| 2021 | $2,435 | $287,326 | $42,875 | $244,451 |
| 2020 | $2,384 | $287,326 | $42,875 | $244,451 |
| 2019 | $2,384 | $287,326 | $42,875 | $244,451 |
| 2018 | $2,431 | $272,044 | $34,300 | $237,744 |
| 2017 | $2,404 | $272,044 | $34,300 | $237,744 |
| 2016 | $2,302 | $272,044 | $34,300 | $237,744 |
| 2015 | $2,381 | $249,224 | $40,022 | $209,202 |
| 2014 | $2,381 | $249,224 | $40,022 | $209,202 |
Source: Public Records
Map
Nearby Homes
- 5807 Craig Rd
- 6208 Craig Rd
- 12 Crail Ct
- 6 Horizon Cir
- 6501 Deerview Trail
- 134 Eagles Nest Dr
- 5803 Lillie Dr
- 5120 Raintree Rd
- 109 November Dr
- 111 November Dr
- 2222 Umstead Rd
- 316 Continental Dr
- 6101 Bent Oak Dr
- 1011 Umstead Rd
- 1013 Umstead Rd
- 6782 Calais Dr
- 9 Otters Run
- 3621 Bivins Rd
- 204 Accura Ct
- 1113 Umstead Grove Way
- 2822 Split Rail Place
- 2816 Split Rail Place
- 5716 Kith Place
- 5720 Kith Place
- 2904 Split Rail Place
- 2812 Split Rail Place
- 2825 Split Rail Place
- 2829 Split Rail Place
- 2821 Split Rail Place
- 2833 Split Rail Place
- 2903 Split Rail Place
- 2907 Split Rail Place
- 2811 Split Rail Place
- 2808 Split Rail Place
- 2817 Split Rail Place
- 5738 Craig Rd
- 2903 Tavistock Dr
- 2903 Tavistock Dr
- 5702 Craig Rd
- 2911 Tavistock Dr
Your Personal Tour Guide
Ask me questions while you tour the home.