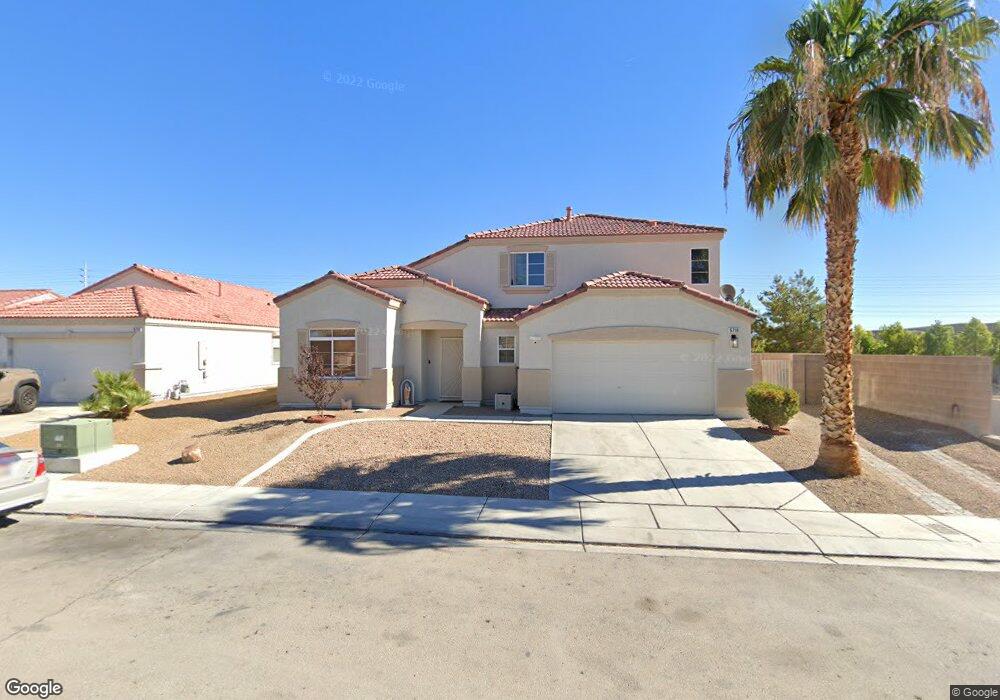
5710 Montezuma Creek St Unit 1 North Las Vegas, NV 89031
Craig Ranch NeighborhoodEstimated Value: $410,492 - $429,000
3
Beds
2
Baths
1,712
Sq Ft
$245/Sq Ft
Est. Value
About This Home
This home is located at 5710 Montezuma Creek St Unit 1, North Las Vegas, NV 89031 and is currently estimated at $420,123, approximately $245 per square foot. 5710 Montezuma Creek St Unit 1 is a home located in Clark County with nearby schools including Eva G. Simmons Elementary School, Brian & Teri Cram Middle School, and Shadow Ridge High School.
Ownership History
Date
Name
Owned For
Owner Type
Purchase Details
Closed on
Feb 28, 2011
Sold by
Fannie Mae
Bought by
Chandler Denise M
Current Estimated Value
Home Financials for this Owner
Home Financials are based on the most recent Mortgage that was taken out on this home.
Original Mortgage
$109,635
Outstanding Balance
$74,903
Interest Rate
4.67%
Mortgage Type
FHA
Estimated Equity
$345,220
Purchase Details
Closed on
Nov 9, 2010
Sold by
Trujillo John
Bought by
Fannie Mae and Federal National Mortgage Association
Purchase Details
Closed on
Aug 15, 2003
Sold by
Centex Homes
Bought by
Trujillo John
Home Financials for this Owner
Home Financials are based on the most recent Mortgage that was taken out on this home.
Original Mortgage
$173,450
Interest Rate
5.46%
Mortgage Type
Unknown
Create a Home Valuation Report for This Property
The Home Valuation Report is an in-depth analysis detailing your home's value as well as a comparison with similar homes in the area
Home Values in the Area
Average Home Value in this Area
Purchase History
| Date | Buyer | Sale Price | Title Company |
|---|---|---|---|
| Chandler Denise M | $112,500 | Stewart Title Las Vegas War | |
| Fannie Mae | $234,695 | Accommodation | |
| Trujillo John | $182,595 | Commerce Title |
Source: Public Records
Mortgage History
| Date | Status | Borrower | Loan Amount |
|---|---|---|---|
| Open | Chandler Denise M | $109,635 | |
| Previous Owner | Trujillo John | $173,450 |
Source: Public Records
Tax History Compared to Growth
Tax History
| Year | Tax Paid | Tax Assessment Tax Assessment Total Assessment is a certain percentage of the fair market value that is determined by local assessors to be the total taxable value of land and additions on the property. | Land | Improvement |
|---|---|---|---|---|
| 2025 | $1,548 | $101,351 | $34,650 | $66,701 |
| 2024 | $1,503 | $101,351 | $34,650 | $66,701 |
| 2023 | $1,212 | $94,346 | $31,500 | $62,846 |
| 2022 | $1,460 | $83,697 | $26,250 | $57,447 |
| 2021 | $1,417 | $78,410 | $23,800 | $54,610 |
| 2020 | $1,373 | $77,240 | $23,100 | $54,140 |
| 2019 | $1,356 | $74,261 | $21,000 | $53,261 |
| 2018 | $1,294 | $67,677 | $16,800 | $50,877 |
| 2017 | $2,134 | $63,622 | $15,750 | $47,872 |
| 2016 | $1,212 | $48,267 | $8,750 | $39,517 |
| 2015 | $1,209 | $37,345 | $7,000 | $30,345 |
| 2014 | $1,174 | $34,745 | $7,000 | $27,745 |
Source: Public Records
Map
Nearby Homes
- 5712 Wishing Coin Ct
- 3835 Enchanted Wells Ave
- 5735 Sanibel Bay Ct
- 5620 Siena Rose St
- 3412 Sunrise Rose Ave
- 3516 Bryan Keith Ave
- 5526 Megan Faye St
- 4062 W El Campo Grande Ave Unit 5
- 5923 Sunrise Creek St
- 3729 Shimmering Creek Ave
- 5845 Gentle Creek Ln
- 3304 W El Campo Grande Ave
- 5430 Winterdale St
- 3213 Inlet Bay Ave
- 5418 Iberville St
- 3214 Inlet Bay Ave
- 3821 Champagne Wood Dr
- 3123 Inlet Bay Ave
- 3509 Red Fire Ave
- 4204 Autumndale Ave
- 5714 Montezuma Creek St
- 3804 Enchanted Wells Ave
- 5722 Montezuma Creek St
- 3811 Aspen Creek Ave
- 3808 Enchanted Wells Ave
- 3808 Aspen Creek Ave
- 3812 Enchanted Wells Ave
- 3815 Aspen Creek Ave
- 3816 Enchanted Wells Ave
- 5732 Montezuma Creek St Unit n/a
- 5732 Montezuma Creek St Unit 1
- 3812 Aspen Creek Ave
- 5731 Ripple Creek St
- 3820 Enchanted Wells Ave
- 3803 Enchanted Wells Ave
- 5731 Montezuma Creek St
- 3819 Aspen Creek Ave
- 3824 Enchanted Wells Ave
- 5736 Montezuma Creek St
- 5726 Ripple Creek St