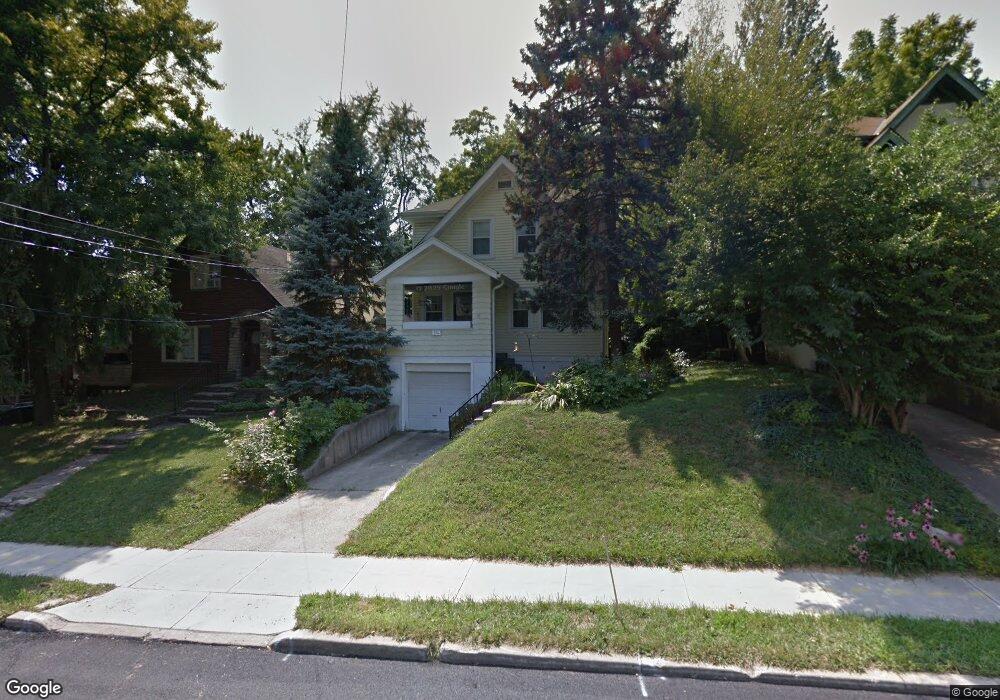
5711 Lester Rd Cincinnati, OH 45213
Pleasant Ridge NeighborhoodEstimated Value: $302,000 - $392,000
3
Beds
3
Baths
1,712
Sq Ft
$209/Sq Ft
Est. Value
About This Home
This home is located at 5711 Lester Rd, Cincinnati, OH 45213 and is currently estimated at $357,314, approximately $208 per square foot. 5711 Lester Rd is a home located in Hamilton County with nearby schools including Pleasant Ridge Montessori School, Shroder High School, and Clark Montessori High School.
Ownership History
Date
Name
Owned For
Owner Type
Purchase Details
Closed on
Oct 28, 2005
Sold by
Rudolph Jeffrey A and Rudolph Kristen R
Bought by
Flores Grant
Current Estimated Value
Home Financials for this Owner
Home Financials are based on the most recent Mortgage that was taken out on this home.
Original Mortgage
$145,000
Outstanding Balance
$78,718
Interest Rate
5.89%
Mortgage Type
Fannie Mae Freddie Mac
Estimated Equity
$278,596
Purchase Details
Closed on
Mar 15, 2001
Sold by
Beth Schutter Mary
Bought by
Rudolph Jeffrey A and Rudolph Kristen R
Home Financials for this Owner
Home Financials are based on the most recent Mortgage that was taken out on this home.
Original Mortgage
$149,000
Interest Rate
7.13%
Purchase Details
Closed on
Jul 29, 1994
Sold by
Carroll William J and Jennifer Carroll M
Bought by
Schutter Mary Beth
Home Financials for this Owner
Home Financials are based on the most recent Mortgage that was taken out on this home.
Original Mortgage
$100,562
Interest Rate
8.41%
Mortgage Type
FHA
Create a Home Valuation Report for This Property
The Home Valuation Report is an in-depth analysis detailing your home's value as well as a comparison with similar homes in the area
Home Values in the Area
Average Home Value in this Area
Purchase History
| Date | Buyer | Sale Price | Title Company |
|---|---|---|---|
| Flores Grant | $155,000 | None Available | |
| Rudolph Jeffrey A | $146,800 | -- | |
| Schutter Mary Beth | -- | -- |
Source: Public Records
Mortgage History
| Date | Status | Borrower | Loan Amount |
|---|---|---|---|
| Open | Flores Grant | $145,000 | |
| Previous Owner | Rudolph Jeffrey A | $149,000 | |
| Previous Owner | Schutter Mary Beth | $100,562 |
Source: Public Records
Tax History Compared to Growth
Tax History
| Year | Tax Paid | Tax Assessment Tax Assessment Total Assessment is a certain percentage of the fair market value that is determined by local assessors to be the total taxable value of land and additions on the property. | Land | Improvement |
|---|---|---|---|---|
| 2024 | $4,663 | $78,061 | $19,432 | $58,629 |
| 2023 | $4,769 | $78,061 | $19,432 | $58,629 |
| 2022 | $4,294 | $63,032 | $14,662 | $48,370 |
| 2021 | $4,132 | $63,032 | $14,662 | $48,370 |
| 2020 | $4,253 | $63,032 | $14,662 | $48,370 |
| 2019 | $3,974 | $53,872 | $12,530 | $41,342 |
| 2018 | $3,980 | $53,872 | $12,530 | $41,342 |
| 2017 | $3,781 | $53,872 | $12,530 | $41,342 |
| 2016 | $3,565 | $50,079 | $12,492 | $37,587 |
| 2015 | $3,214 | $50,079 | $12,492 | $37,587 |
| 2014 | $3,237 | $50,079 | $12,492 | $37,587 |
| 2013 | $3,137 | $47,695 | $11,897 | $35,798 |
Source: Public Records
Map
Nearby Homes
- 5715 Lester Rd
- 5719 Lester Rd
- 5703 Lester Rd
- 5710 Marmion Ln
- 5723 Lester Rd
- 5706 Marmion Ln
- 5714 Marmion Ln
- 3003 Beaver Ave
- 5702 Marmion Ln
- 5718 Marmion Ln
- 5727 Lester Rd
- 5700 Marmion Ln
- 5633 Lester Rd
- 5722 Marmion Ln
- 3007 Beaver Ave
- 5724 Lester Rd
- 5731 Lester Rd
- 5726 Marmion Ln
- 5623 Lester Rd
- 5695 Marmion Ln