
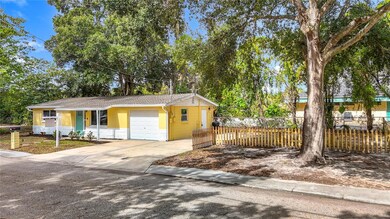
5711 Pine St New Port Richey, FL 34652
South New Port Richey NeighborhoodEstimated payment $1,175/month
Highlights
- Open Floorplan
- Solid Surface Countertops
- 1 Car Attached Garage
- Contemporary Architecture
- No HOA
- Eat-In Kitchen
About This Home
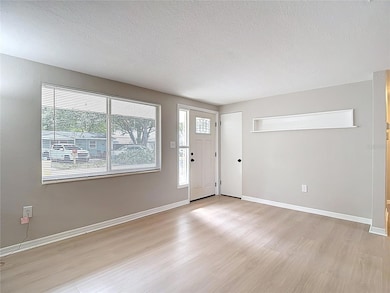
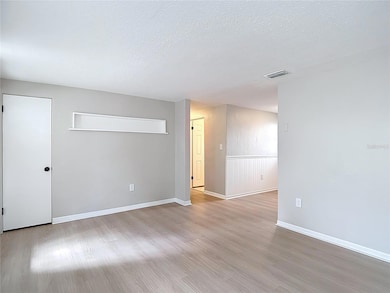
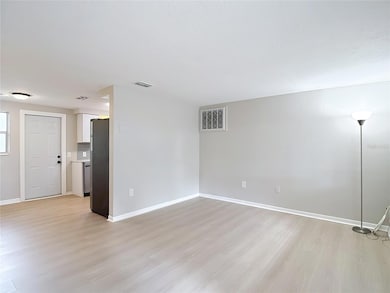
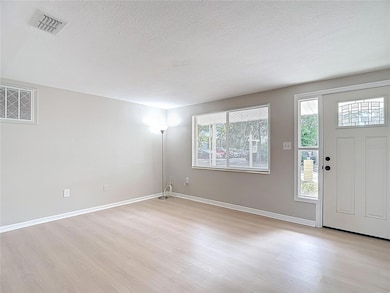
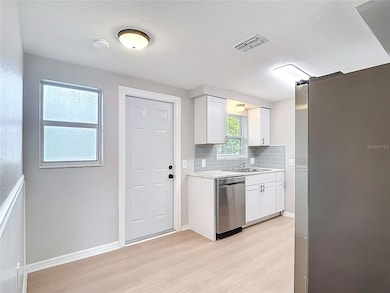
Charming and completely remodeled on oversized lot! Located just a few minutes from downtown New Port Richey! This move-in ready 2 bedroom, 1 bath, 1 car garage home with washer/dryer boasts great curb appeal on a very quiet and peaceful lot. Adding to the appeal is a serene fenced in HUGE yard. Bring your boat, rv, trailer, vehicles or whatever else you can fit. The home features a bright living space with new vinyl windows and window treatments throughout. Roof replaced 2022. PVC plumbing. Newer electric panel and water heater. Recently replaced A/C. Huge concrete double driveway. Stainless appliances. Exterior paint 2025. New gutters 2025. Newer garage door. This home is NOT located in a flood zone. No flood insurance required. No HOA! As you enter the home you are greeted by newly laid luxury vinyl plank flooring. As you enter the kitchen space you will notice brand new shaker cabinets, stainless appliances, gorgeous countertops, custom backsplash and new fixtures/hardware. You will also notice the the newly painted garage floors and laundry room. Moving on you will find the bathroom which is breathtaking! You will find luxury custom tile on the floors and bathtub shower enclosure, newly textured and painted walls, a beautiful contemporary vanity and all new fixtures. This is a bath you must see to appreciate. Both bedrooms are newly carpeted and offer great size closets. Lot's of storage in this one. Washer and dryer included. Enjoy all that New Port Richey and Tampa Bay has to offer! New Port Richey is a golf cart-friendly community. Walking distance to stores and public transportation. Downtown offers multiple restaurants, breweries, and shops. Explore Sims Park with boat ramp access, kayak launch area, playground, and year-round events. The Recreation Center is also nearby, offering classes, an aquatic center, and outdoor activities. Close to airports, beaches, parks, river, theme parks, and other attractions. Schedule a showing today. This one won't last!
Listing Agent
LPT REALTY, LLC Brokerage Phone: 877-366-2213 License #3483250 Listed on: 10/31/2025

Home Details
Home Type
- Single Family
Est. Annual Taxes
- $1,530
Year Built
- Built in 1966
Lot Details
- 5,125 Sq Ft Lot
- South Facing Home
- Dog Run
Parking
- 1 Car Attached Garage
Home Design
- Contemporary Architecture
- Slab Foundation
- Shingle Roof
- Block Exterior
Interior Spaces
- 864 Sq Ft Home
- 1-Story Property
- Open Floorplan
- Ceiling Fan
- Awning
- Window Treatments
- Combination Dining and Living Room
- Vinyl Flooring
Kitchen
- Eat-In Kitchen
- Range
- Microwave
- Dishwasher
- Solid Surface Countertops
Bedrooms and Bathrooms
- 2 Bedrooms
- 1 Full Bathroom
Laundry
- Laundry Room
- Laundry in Garage
- Dryer
- Washer
Outdoor Features
- Exterior Lighting
- Rain Gutters
- Private Mailbox
Utilities
- Central Heating and Cooling System
- Thermostat
- Electric Water Heater
- Cable TV Available
Community Details
- No Home Owners Association
- Ce Crafts Sub #3 Subdivision
Listing and Financial Details
- Visit Down Payment Resource Website
- Legal Lot and Block 10 / 3
- Assessor Parcel Number 08-26-16-0240-00300-0101
Map
Home Values in the Area
Average Home Value in this Area
Tax History
| Year | Tax Paid | Tax Assessment Tax Assessment Total Assessment is a certain percentage of the fair market value that is determined by local assessors to be the total taxable value of land and additions on the property. | Land | Improvement |
|---|---|---|---|---|
| 2025 | $1,530 | $62,708 | $13,325 | $49,383 |
| 2024 | $1,530 | $63,183 | $13,325 | $49,858 |
| 2023 | $1,356 | $45,459 | $13,325 | $32,134 |
| 2022 | $1,250 | $42,670 | $13,325 | $29,345 |
| 2021 | $1,178 | $40,075 | $13,325 | $26,750 |
| 2020 | $1,102 | $39,505 | $13,325 | $26,180 |
| 2019 | $1,110 | $39,859 | $13,325 | $26,534 |
| 2018 | $1,089 | $38,876 | $13,325 | $25,551 |
| 2017 | $1,075 | $37,625 | $13,325 | $24,300 |
| 2016 | $1,064 | $36,868 | $13,325 | $23,543 |
| 2015 | $1,057 | $35,907 | $13,325 | $22,582 |
| 2014 | $1,045 | $35,345 | $13,325 | $22,020 |
Property History
| Date | Event | Price | List to Sale | Price per Sq Ft |
|---|---|---|---|---|
| 11/30/2025 11/30/25 | Price Changed | $199,000 | -0.5% | $230 / Sq Ft |
| 11/10/2025 11/10/25 | Price Changed | $200,000 | -4.8% | $231 / Sq Ft |
| 10/31/2025 10/31/25 | For Sale | $210,000 | -- | $243 / Sq Ft |
Purchase History
| Date | Type | Sale Price | Title Company |
|---|---|---|---|
| Warranty Deed | $117,500 | Legal Sun Title | |
| Quit Claim Deed | $100 | None Listed On Document | |
| Quit Claim Deed | -- | None Listed On Document | |
| Quit Claim Deed | -- | None Listed On Document | |
| Warranty Deed | $45,000 | Sunmark Title Insurance Agen | |
| Warranty Deed | $30,000 | Sunmark Title Ins Group Inc |
Mortgage History
| Date | Status | Loan Amount | Loan Type |
|---|---|---|---|
| Previous Owner | $30,000 | Seller Take Back |
Source: Stellar MLS
MLS Number: TB8443718
APN: 08-26-16-0240-00300-0101
Disclaimer: Certain information contained herein is derived from information provided by parties other than Homes.com. All information provided is deemed reliable, but is not guaranteed to be accurate and should be independently verified.
![]() IDX information is provided exclusively for personal, non-commercial use, and may not be used for any purpose other than to identify prospective properties consumers may be interested in purchasing. Information is deemed reliable but not guaranteed.
IDX information is provided exclusively for personal, non-commercial use, and may not be used for any purpose other than to identify prospective properties consumers may be interested in purchasing. Information is deemed reliable but not guaranteed.
Listing Information presented by local MLS brokerage: Ten-X - (888)-952-6393
- 5749 Pine St
- 5742 Meadowlane St
- 5625 High St
- 5652 High St
- 5649 Tidalwave Dr
- 5627 Ferguson Ct Unit 1303
- 5436 Amy Ln
- 5640 Ferguson Ct Unit 2203
- 5421 Gulf Dr
- 6007 Corson Ave
- 6016 Arthur Ave
- 5649 Oak Ridge Ave
- 5031 Overlook Dr
- 5023 Thames Dr
- 5255 School Rd
- 0 Ridgewood Dr
- 5750 Georgia Ave
- 5045 Grand Blvd
- 5240 School Rd
- 5633 Charles St
- 5823 Elm St
- 5712 Townhouse Dr
- 5924 Pine St
- 5604 Essex Way
- 5415 Lemon St Unit 5417 Lemon Street, Unit 2
- 5417 Lemon St Unit 5417 Lemon St Back Unit
- 5228 School Rd
- 5839 Grand Blvd
- 6024 Georgia Ave
- 5568 Frances Ave
- 4851 Euclid Ave Unit 4851
- 6370 Conniewood Square
- 5615 Leisure Ln
- 6220 Glenwood Dr
- 4847 Elmwood St
- 5803 Delaware Ave
- 5030 Herring Ct
- 5026 Bitner St
- 4746 Azalea Dr Unit 105
- 4934 Hazner St Unit 4934