Estimated Value: $379,996 - $423,000
2
Beds
3
Baths
938
Sq Ft
$430/Sq Ft
Est. Value
About This Home
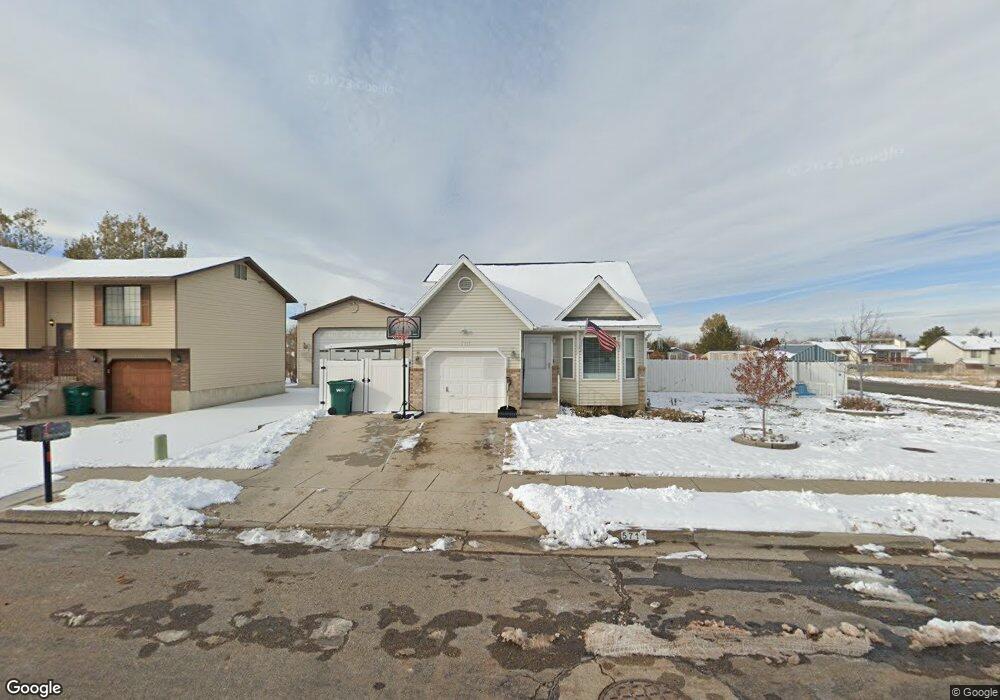
This home is located at 5711 S 3850 W, Roy, UT 84067 and is currently estimated at $402,999, approximately $429 per square foot. 5711 S 3850 W is a home located in Weber County with nearby schools including Freedom School, Roy Junior High School, and Roy High School.
Ownership History
Date
Name
Owned For
Owner Type
Purchase Details
Closed on
Feb 7, 2020
Sold by
Knighton Daniel J and Knighton Lynette A
Bought by
Knighton Daniel James and Knighton Lynette Arave
Current Estimated Value
Purchase Details
Closed on
Mar 21, 2013
Sold by
Knighton Lynette A
Bought by
Knighton Daniel J
Home Financials for this Owner
Home Financials are based on the most recent Mortgage that was taken out on this home.
Original Mortgage
$74,000
Interest Rate
3.49%
Mortgage Type
New Conventional
Purchase Details
Closed on
Apr 16, 2010
Sold by
Knighton Lynette A
Bought by
Knighton Daniel J
Home Financials for this Owner
Home Financials are based on the most recent Mortgage that was taken out on this home.
Original Mortgage
$59,000
Interest Rate
4.94%
Mortgage Type
New Conventional
Create a Home Valuation Report for This Property
The Home Valuation Report is an in-depth analysis detailing your home's value as well as a comparison with similar homes in the area
Home Values in the Area
Average Home Value in this Area
Purchase History
| Date | Buyer | Sale Price | Title Company |
|---|---|---|---|
| Knighton Daniel James | -- | None Available | |
| Knighton Daniel J | -- | Accommodation | |
| Knighton Lynette A | -- | Security Title Of Davis Coun | |
| Knighton Daniel J | -- | Inwest Title Services Layton | |
| Knighton Lynette A | -- | Inwest Title Services Layton |
Source: Public Records
Mortgage History
| Date | Status | Borrower | Loan Amount |
|---|---|---|---|
| Closed | Knighton Lynette A | $74,000 | |
| Closed | Knighton Daniel J | $59,000 |
Source: Public Records
Tax History
| Year | Tax Paid | Tax Assessment Tax Assessment Total Assessment is a certain percentage of the fair market value that is determined by local assessors to be the total taxable value of land and additions on the property. | Land | Improvement |
|---|---|---|---|---|
| 2025 | $2,302 | $359,225 | $145,004 | $214,221 |
| 2024 | $2,251 | $194,699 | $79,752 | $114,947 |
| 2023 | $2,324 | $202,950 | $74,166 | $128,784 |
| 2022 | $2,197 | $196,350 | $60,501 | $135,849 |
| 2021 | $1,895 | $279,000 | $79,963 | $199,037 |
| 2020 | $1,789 | $242,000 | $79,963 | $162,037 |
| 2019 | $1,806 | $231,000 | $49,906 | $181,094 |
| 2018 | $1,633 | $195,000 | $46,982 | $148,018 |
| 2017 | $1,486 | $165,000 | $46,982 | $118,018 |
| 2016 | $1,432 | $85,446 | $23,077 | $62,369 |
| 2015 | $1,310 | $79,598 | $23,077 | $56,521 |
| 2014 | $1,241 | $73,955 | $23,077 | $50,878 |
Source: Public Records
Map
Nearby Homes
- 3826 W 5750 S
- 3832 W 5625 S
- 5773 S 3850 W
- 5412 S 3925 W
- 5444 S 4050 W
- 5854 S 3500 W
- 2216 W 2615 N Unit 142
- 2208 W 2615 N
- 2208 W 2615 N Unit 141
- 2186 W 2615 N
- 2186 W 2615 N Unit 139
- 2606 N 2125 W
- 2606 N 2125 W Unit 149
- 2602 N 2125 W
- 2602 N 2125 W Unit 150
- 2596 N 2125 W Unit 151
- 2596 N 2125 W
- 4264 W 6025 S
- 2657 N 2000 W
- 2566 N 2125 W
Your Personal Tour Guide
Ask me questions while you tour the home.