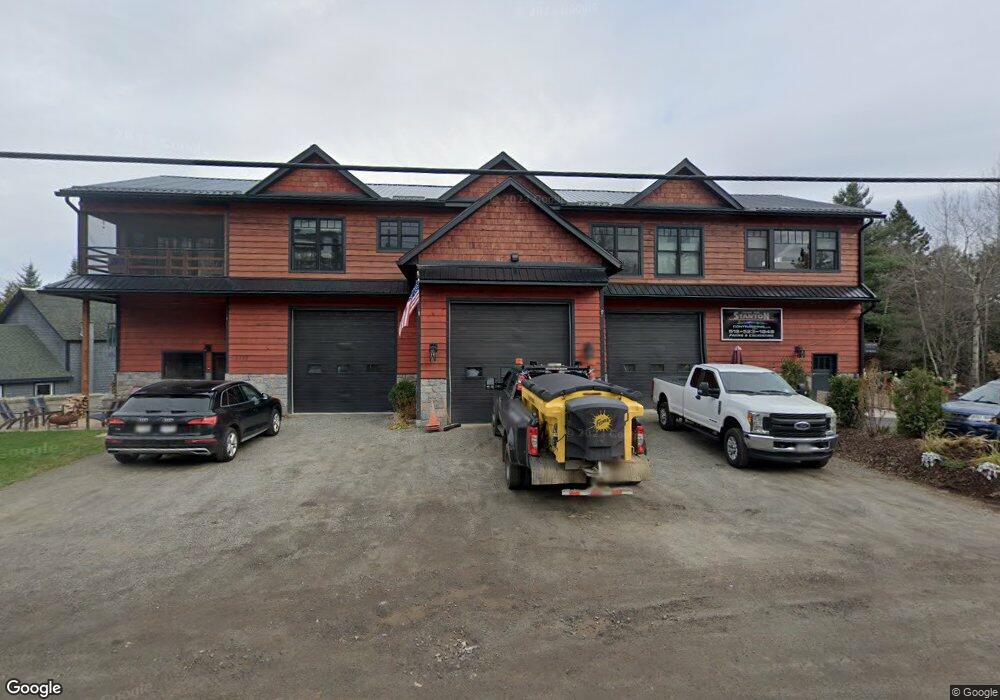
5712 Cascade Rd Lake Placid, NY 12946
Estimated Value: $207,000
3
Beds
2
Baths
2,190
Sq Ft
$95/Sq Ft
Est. Value
About This Home
This home is located at 5712 Cascade Rd, Lake Placid, NY 12946 and is currently priced at $207,000, approximately $94 per square foot. 5712 Cascade Rd is a home located in Essex County with nearby schools including Lake Placid Elementary School, Lake Placid Junior/Senior High School, and St. Agnes School.
Ownership History
Date
Name
Owned For
Owner Type
Purchase Details
Closed on
Aug 10, 2020
Sold by
Essex County Of
Bought by
Joelandkimstanton Llc
Current Estimated Value
Purchase Details
Closed on
Nov 25, 2015
Sold by
Benson Mary
Bought by
Brewster Steve
Home Financials for this Owner
Home Financials are based on the most recent Mortgage that was taken out on this home.
Original Mortgage
$70,200
Interest Rate
3.97%
Mortgage Type
Commercial
Purchase Details
Closed on
Apr 23, 2013
Sold by
Fortune Estates Prop Llc
Bought by
Benson Mary
Purchase Details
Closed on
Jun 29, 2006
Sold by
Stanton James
Bought by
Fortune Estates Propertie S Llc
Purchase Details
Closed on
Feb 16, 1996
Sold by
Dellavalle Patrick
Bought by
Stanton James
Purchase Details
Closed on
Dec 19, 1994
Bought by
Dellavalle Patrick
Create a Home Valuation Report for This Property
The Home Valuation Report is an in-depth analysis detailing your home's value as well as a comparison with similar homes in the area
Home Values in the Area
Average Home Value in this Area
Purchase History
| Date | Buyer | Sale Price | Title Company |
|---|---|---|---|
| Joelandkimstanton Llc | -- | None Available | |
| Joelandkimstanton Llc | -- | None Available | |
| Brewster Steve | $96,320 | Evan Bracy | |
| Brewster Steve | $96,320 | Evan Bracy | |
| Benson Mary | $107,255 | -- | |
| Benson Mary | $107,255 | -- | |
| Fortune Estates Propertie S Llc | $250,000 | Matthew D Norfolk | |
| Fortune Estates Propertie S Llc | $250,000 | Matthew D Norfolk | |
| Stanton James | $92,078 | -- | |
| Stanton James | $92,078 | -- | |
| Dellavalle Patrick | -- | -- | |
| Dellavalle Patrick | -- | -- |
Source: Public Records
Mortgage History
| Date | Status | Borrower | Loan Amount |
|---|---|---|---|
| Previous Owner | Brewster Steve | $70,200 |
Source: Public Records
Tax History Compared to Growth
Tax History
| Year | Tax Paid | Tax Assessment Tax Assessment Total Assessment is a certain percentage of the fair market value that is determined by local assessors to be the total taxable value of land and additions on the property. | Land | Improvement |
|---|---|---|---|---|
| 2024 | $3,847 | $393,600 | $141,400 | $252,200 |
| 2023 | $3,862 | $378,500 | $136,100 | $242,400 |
| 2022 | $4,207 | $357,100 | $112,500 | $244,600 |
| 2021 | $4,399 | $346,700 | $61,700 | $285,000 |
| 2020 | $2,435 | $99,800 | $56,300 | $43,500 |
| 2019 | $2,408 | $99,800 | $56,300 | $43,500 |
| 2018 | $2,375 | $99,800 | $56,300 | $43,500 |
| 2017 | $1,679 | $105,500 | $78,100 | $27,400 |
| 2016 | $2,407 | $105,500 | $78,100 | $27,400 |
| 2015 | -- | $105,500 | $78,100 | $27,400 |
| 2014 | -- | $105,500 | $78,100 | $27,400 |
Source: Public Records
Map
Nearby Homes
- 0 Cascade Rd
- 5880 Cascade Rd
- 136 Old Military Rd
- 50 Liberty Hill Ln
- 152 Old Military Rd
- 5893 Cascade Rd
- 5885 Cascade Rd
- 5493 Cascade Rd
- 6 Bear Cub Ln
- 158 Newman Rd
- 6021 Sentinel Rd
- 50 Alpine Way
- 116 Bear Cub Ln
- 2810 Wilmington Rd Unit 1
- 0 Stage Coach Way
- 39 Trillium Dr
- 20 Morningside Dr Unit BLD 3, unit 12, week
- 20 Morningside Dr Unit BLD 3, unit 11, week
- 20 Morningside Dr Unit BLD 3, unit 13, week
- 6144 Sentinel Rd Unit 1
- 5720 Cascade Rd
- 5718 Cascade Rd
- 5708 Cascade Rd
- 5686 Cascade Rd
- 5676 Cascade Rd
- 5671 Cascade Rd
- 5691 Cascade Rd
- 30 Juniper Cir
- 48 Juniper Cir
- 43 Juniper Cir
- 29 Juniper Cir
- 28 Juniper Cir
- 5 Liberty Hill Ln
- 52 Juniper Cir
- 26 Juniper Cir
- 51 Juniper Cir
- 21 Juniper Cir
- 22 Juniper Cir
- 16 Barkeater Way Unit 3
- 16 Barkeater Way Unit 1