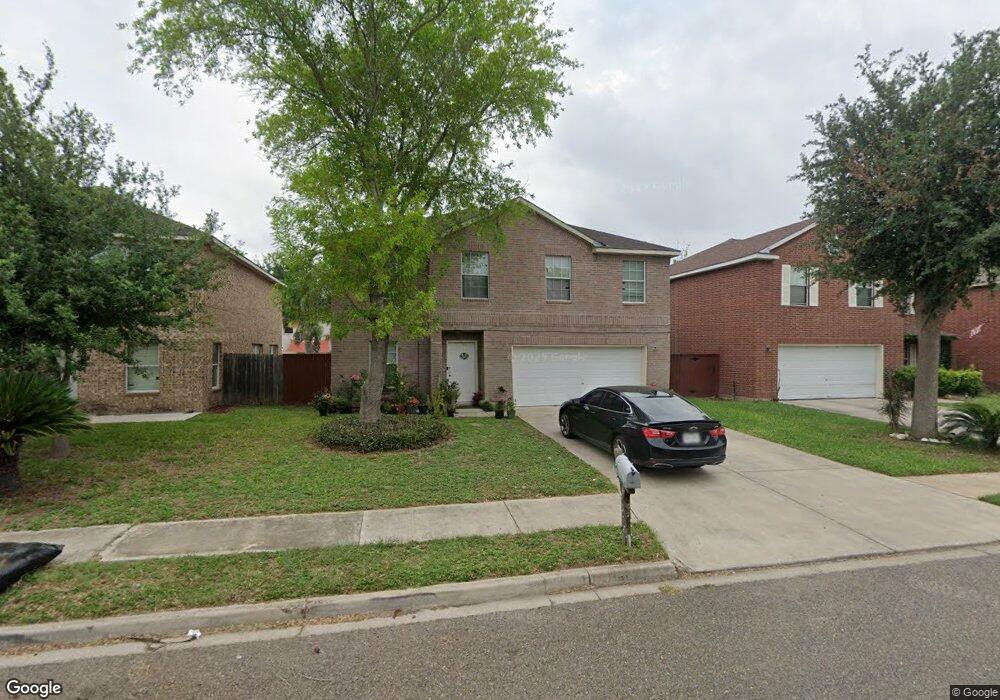
5712 N 36th St McAllen, TX 78504
Estimated Value: $271,895 - $345,000
4
Beds
2
Baths
2,762
Sq Ft
$109/Sq Ft
Est. Value
About This Home
This home is located at 5712 N 36th St, McAllen, TX 78504 and is currently estimated at $300,974, approximately $108 per square foot. 5712 N 36th St is a home located in Hidalgo County with nearby schools including Garza Elementary School, Michael E. Fossum Middle School, and Rowe High School.
Ownership History
Date
Name
Owned For
Owner Type
Purchase Details
Closed on
Jul 7, 2025
Sold by
Castillo Jaime Flores
Bought by
Zavala Miguel Angel Colora
Current Estimated Value
Purchase Details
Closed on
Jun 1, 2018
Sold by
Flores Octavio A
Bought by
Castillo Jaime Flores
Purchase Details
Closed on
Jul 14, 2016
Sold by
Castillo Jaime Flores
Bought by
Flores Octavio A
Purchase Details
Closed on
Jun 13, 2016
Sold by
Angel Alma Angelica Castro Del and De Flores Alma Angelica Castro
Bought by
Castillo Jaime Flores
Purchase Details
Closed on
Nov 1, 2011
Sold by
Castillo Jaime Flores and De Flores Alma Angelica Castro
Bought by
U S Bank National Association
Purchase Details
Closed on
Sep 27, 2005
Sold by
Obra Homes Inc
Bought by
Castillo Jaime Flores and Deflores Alma Angelica
Home Financials for this Owner
Home Financials are based on the most recent Mortgage that was taken out on this home.
Original Mortgage
$89,250
Interest Rate
5.76%
Mortgage Type
New Conventional
Create a Home Valuation Report for This Property
The Home Valuation Report is an in-depth analysis detailing your home's value as well as a comparison with similar homes in the area
Home Values in the Area
Average Home Value in this Area
Purchase History
| Date | Buyer | Sale Price | Title Company |
|---|---|---|---|
| Zavala Miguel Angel Colora | -- | Corporation Service | |
| Castillo Jaime Flores | -- | None Available | |
| Flores Octavio A | -- | None Available | |
| Castillo Jaime Flores | -- | None Available | |
| U S Bank National Association | $87,267 | None Available | |
| Castillo Jaime Flores | -- | None Available |
Source: Public Records
Mortgage History
| Date | Status | Borrower | Loan Amount |
|---|---|---|---|
| Previous Owner | Castillo Jaime Flores | $89,250 |
Source: Public Records
Tax History Compared to Growth
Tax History
| Year | Tax Paid | Tax Assessment Tax Assessment Total Assessment is a certain percentage of the fair market value that is determined by local assessors to be the total taxable value of land and additions on the property. | Land | Improvement |
|---|---|---|---|---|
| 2025 | $5,358 | $244,251 | $46,000 | $198,251 |
| 2024 | $5,358 | $228,488 | $46,000 | $182,488 |
| 2023 | $5,425 | $230,608 | $46,000 | $184,608 |
| 2022 | $5,253 | $211,832 | $46,000 | $165,832 |
| 2021 | $4,667 | $182,664 | $46,000 | $136,664 |
| 2020 | $3,908 | $153,179 | $33,000 | $120,179 |
| 2019 | $3,784 | $149,172 | $33,000 | $116,172 |
| 2018 | $3,248 | $127,825 | $21,000 | $106,825 |
| 2017 | $3,291 | $129,039 | $21,000 | $108,039 |
| 2016 | $3,322 | $130,254 | $21,000 | $109,254 |
| 2015 | $3,554 | $135,290 | $21,000 | $114,290 |
| 2014 | $3,554 | $138,749 | $21,000 | $117,749 |
Source: Public Records
Map
Nearby Homes
- 5509 N 35th St
- 5511 N 36th Ln
- 5604 N 34th St
- 3501 Bluebird Ave
- 5417 N 31st St
- 3800 Xanthisma Ave
- 3001 Bluebird Ave
- 6016 N 36th Ln
- 4012 Avocet Ave
- 6100 N 36th St
- 4217 Hummingbird Ave
- 4204 Hummingbird Ave
- 4200 Hummingbird Ave
- 5605 N 41st St
- 3809 Water Lily Ave
- 3021 Hummingbird Ave
- 4100 Xanthisma Ave
- 5405 N 28th St
- 3400 Ulex Ave
- 3312 Kiwi Ave
- 5708 N 36th St
- 5716 N 36th St
- 5704 N 36th St
- 5720 N 36th St
- 5713 N 35th St
- 5709 N 35th St
- 5717 N 35th St
- 5700 N 36th St
- 3508 Eagle Ave
- 5713 N 36th St
- 5721 N 35th St
- 5717 N 36th St
- 5709 N 36th St
- 5721 N 36th St
- 3504 Eagle Ave
- 5705 N 36th St
- 5701 N 36th St
- 3500 Eagle Ave
- 3516 Falcon Ave
- 3512 Falcon Ave