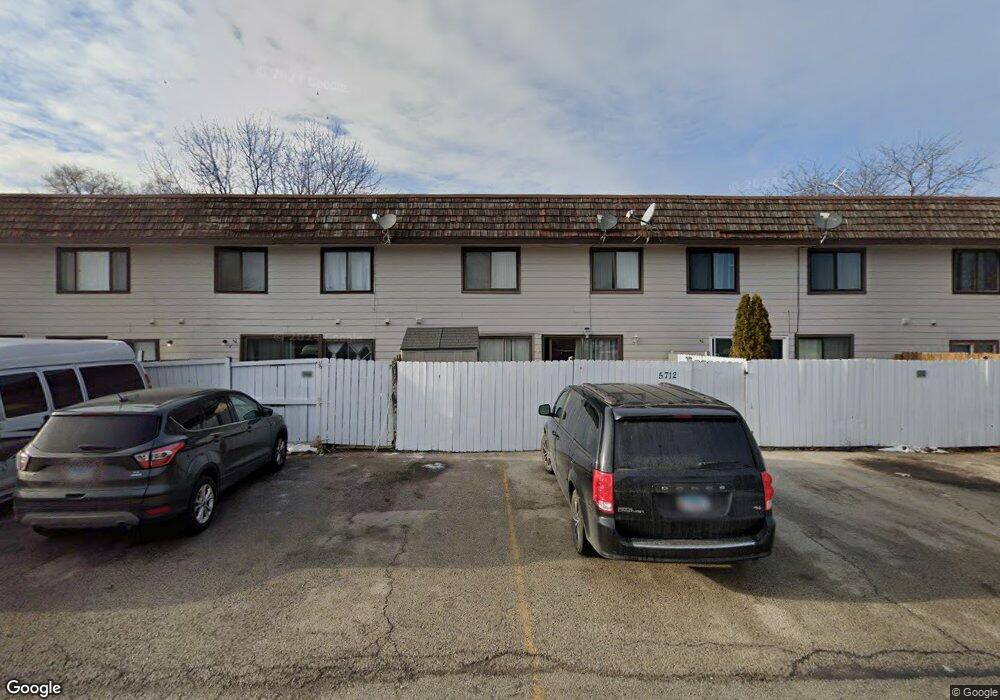
5712 Tiburon Ct Unit 355 Hanover Park, IL 60133
South Tri Village NeighborhoodEstimated Value: $226,000 - $252,821
3
Beds
2
Baths
1,814
Sq Ft
$133/Sq Ft
Est. Value
About This Home
This home is located at 5712 Tiburon Ct Unit 355, Hanover Park, IL 60133 and is currently estimated at $241,205, approximately $132 per square foot. 5712 Tiburon Ct Unit 355 is a home located in DuPage County with nearby schools including Greenbrook Elementary School, Spring Wood Middle School, and Lake Park High School.
Ownership History
Date
Name
Owned For
Owner Type
Purchase Details
Closed on
Dec 22, 2017
Sold by
Adwent Janusz and Adwent Jolanta
Bought by
Valerio Fernando Gallegos
Current Estimated Value
Home Financials for this Owner
Home Financials are based on the most recent Mortgage that was taken out on this home.
Original Mortgage
$131,100
Outstanding Balance
$110,174
Interest Rate
3.87%
Mortgage Type
New Conventional
Estimated Equity
$131,031
Purchase Details
Closed on
Sep 28, 2000
Sold by
Skwatt Joseph and Skwatt Carole
Bought by
Adwent Janusz and Adwent Jolanta
Home Financials for this Owner
Home Financials are based on the most recent Mortgage that was taken out on this home.
Original Mortgage
$97,850
Interest Rate
7.96%
Purchase Details
Closed on
May 29, 1998
Sold by
Kindell Mark S and Kindell Cynthia M
Bought by
Skwatt Joseph and Miara Carole
Home Financials for this Owner
Home Financials are based on the most recent Mortgage that was taken out on this home.
Original Mortgage
$81,785
Interest Rate
7.27%
Mortgage Type
FHA
Create a Home Valuation Report for This Property
The Home Valuation Report is an in-depth analysis detailing your home's value as well as a comparison with similar homes in the area
Home Values in the Area
Average Home Value in this Area
Purchase History
| Date | Buyer | Sale Price | Title Company |
|---|---|---|---|
| Valerio Fernando Gallegos | -- | Saturn Title Llc | |
| Adwent Janusz | $103,000 | -- | |
| Skwatt Joseph | $82,000 | -- |
Source: Public Records
Mortgage History
| Date | Status | Borrower | Loan Amount |
|---|---|---|---|
| Open | Valerio Fernando Gallegos | $131,100 | |
| Previous Owner | Adwent Janusz | $97,850 | |
| Previous Owner | Skwatt Joseph | $81,785 |
Source: Public Records
Tax History Compared to Growth
Tax History
| Year | Tax Paid | Tax Assessment Tax Assessment Total Assessment is a certain percentage of the fair market value that is determined by local assessors to be the total taxable value of land and additions on the property. | Land | Improvement |
|---|---|---|---|---|
| 2024 | $5,124 | $60,044 | $6,692 | $53,352 |
| 2023 | $4,845 | $54,910 | $6,120 | $48,790 |
| 2022 | $4,703 | $50,190 | $6,080 | $44,110 |
| 2021 | $4,357 | $47,690 | $5,780 | $41,910 |
| 2020 | $4,161 | $46,530 | $5,640 | $40,890 |
| 2019 | $4,021 | $44,710 | $5,420 | $39,290 |
| 2018 | $2,716 | $29,810 | $5,290 | $24,520 |
| 2017 | $2,574 | $27,630 | $4,900 | $22,730 |
| 2016 | $2,454 | $25,570 | $4,530 | $21,040 |
| 2015 | $2,422 | $23,860 | $4,230 | $19,630 |
| 2014 | $3,980 | $35,610 | $6,310 | $29,300 |
| 2013 | $3,965 | $36,830 | $6,530 | $30,300 |
Source: Public Records
Map
Nearby Homes
- 1239 San Simeon Dr Unit 186
- 5567 Court f Unit 179
- 5563 Court f Unit 177
- 1336 Court o Unit 225
- 5540 Pebblebeach Dr Unit 284
- 1225 Court c Unit 59
- 5500 Court p Unit 263
- 1183 Hialeah Ln
- 5775 Madrid Ct Unit A
- 1370 Alpine Ct Unit A
- 1395 Alpine Ct Unit C
- 5815 Wilshire Ct Unit B
- 5662 Cambridge Way
- 1233 Citation Ln
- 1607 W Celebrity Cir
- 5711 Ring Ct
- 1710 Arlington Dr
- 1273 Dunamon Dr Unit 107
- 1423 Sacramento Dr Unit 16352
- 6N632 Gary Ave
- 5708 Tiburon Ct Unit 356
- 5716 Tiburon Ct Unit 354
- 5720 Tiburon Ct Unit 353
- 5724 Tiburon Ct Unit 352
- 5700 Tiburon Ct Unit 358
- 5700 Tiburon Ct Unit 5700
- 5728 Tiburon Ct Unit 351
- 5717 Tiburon Ct Unit 350
- 5688 Tiburon Ct
- 5713 Tiburon Ct Unit 349
- 5709 Tiburon Ct
- 5705 Tiburon Ct Unit 347
- 5684 Tiburon Ct
- 5701 Tiburon Ct Unit 346
- 5680 Tiburon Ct Unit 361
- 5676 Tiburon Ct Unit 362
- 5685 Tiburon Ct Unit 381
- 5672 Tiburon Ct
- 5681 Tiburon Ct
- 5677 Tiburon Ct Unit 379