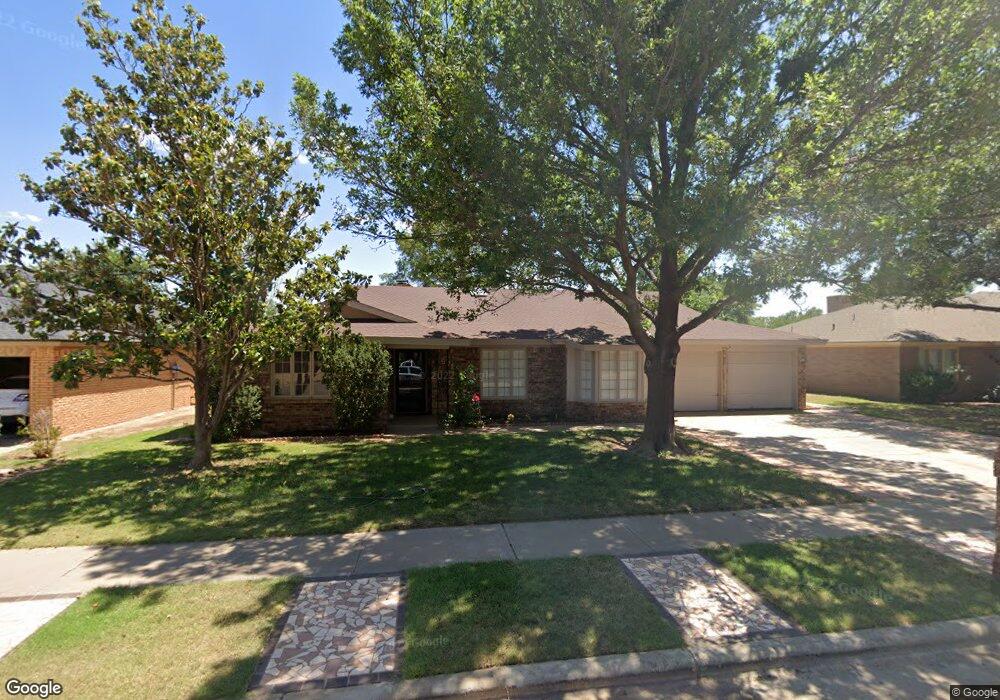
5715 70th Place Lubbock, TX 79424
South West Lubbock NeighborhoodEstimated Value: $305,812 - $325,000
3
Beds
2
Baths
2,637
Sq Ft
$120/Sq Ft
Est. Value
About This Home
This home is located at 5715 70th Place, Lubbock, TX 79424 and is currently estimated at $317,203, approximately $120 per square foot. 5715 70th Place is a home located in Lubbock County with nearby schools including Whiteside Elementary School, Irons Middle School, and Coronado High School.
Ownership History
Date
Name
Owned For
Owner Type
Purchase Details
Closed on
May 17, 2019
Sold by
Whatever Works Llc
Bought by
Malinowski Kimberly and Malinowski John
Current Estimated Value
Home Financials for this Owner
Home Financials are based on the most recent Mortgage that was taken out on this home.
Original Mortgage
$220,875
Outstanding Balance
$193,401
Interest Rate
4%
Mortgage Type
New Conventional
Estimated Equity
$123,802
Purchase Details
Closed on
Jun 28, 2018
Sold by
Lines John Edward and Cluff Lorel
Bought by
Whatever Works Llc
Purchase Details
Closed on
Jun 10, 2011
Sold by
Lines Annabell Denton
Bought by
Cluff Annabell D and Lines Annabell Denton
Purchase Details
Closed on
Dec 9, 2003
Sold by
Lines Family Trust 1998
Bought by
Cluff Annabell D
Purchase Details
Closed on
May 31, 1995
Sold by
Alexander Earnest L and Alexander Murl P
Bought by
Cluff Annabell D
Create a Home Valuation Report for This Property
The Home Valuation Report is an in-depth analysis detailing your home's value as well as a comparison with similar homes in the area
Home Values in the Area
Average Home Value in this Area
Purchase History
| Date | Buyer | Sale Price | Title Company |
|---|---|---|---|
| Malinowski Kimberly | -- | Hub City Title | |
| Whatever Works Llc | -- | Hub City Title | |
| Cluff Annabell D | -- | None Available | |
| Cluff Annabell D | -- | -- | |
| Cluff Annabell D | -- | -- |
Source: Public Records
Mortgage History
| Date | Status | Borrower | Loan Amount |
|---|---|---|---|
| Open | Malinowski Kimberly | $220,875 |
Source: Public Records
Tax History Compared to Growth
Tax History
| Year | Tax Paid | Tax Assessment Tax Assessment Total Assessment is a certain percentage of the fair market value that is determined by local assessors to be the total taxable value of land and additions on the property. | Land | Improvement |
|---|---|---|---|---|
| 2025 | $4,401 | $318,652 | $24,000 | $294,652 |
| 2024 | $4,401 | $304,537 | $24,000 | $280,537 |
| 2023 | $4,941 | $265,815 | $24,000 | $241,815 |
| 2022 | $4,892 | $241,650 | $24,000 | $224,079 |
| 2021 | $4,705 | $219,682 | $24,000 | $195,682 |
| 2020 | $4,742 | $218,090 | $24,000 | $194,090 |
| 2019 | $5,182 | $230,818 | $24,000 | $206,818 |
| 2018 | $5,039 | $224,149 | $24,000 | $200,149 |
| 2017 | $4,586 | $203,772 | $24,000 | $179,772 |
| 2016 | $4,315 | $191,703 | $24,000 | $167,703 |
| 2015 | $1,976 | $174,275 | $12,000 | $162,275 |
| 2014 | $1,976 | $174,275 | $12,000 | $162,275 |
Source: Public Records
Map
Nearby Homes
- 5712 70th Place
- 5717 72nd St
- 6910 Freeport Ave
- 5726 67th St
- 6916 Fulton Ave
- 5511 73rd St
- 5422 69th St
- 5414 70th St
- 5415 68th St
- 5725 64th St
- 5421 73rd St
- 5520 76th St
- 5737 64th St
- 5405 68th St
- 5419 74th St
- 5403 68th St
- 5912 74th St
- 5723 77th St
- 0 Homestead Ave Unit 202410270
- 0 Homestead Ave Unit 202410271