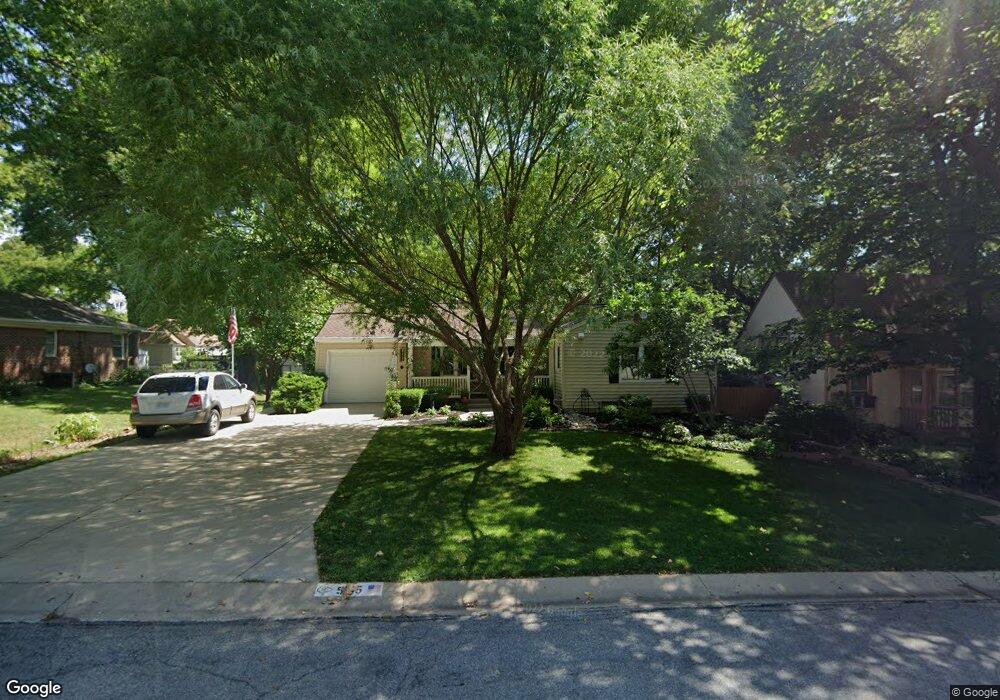
5715 Maple St Mission, KS 66202
Estimated Value: $337,369 - $347,000
3
Beds
2
Baths
1,300
Sq Ft
$263/Sq Ft
Est. Value
About This Home
This home is located at 5715 Maple St, Mission, KS 66202 and is currently estimated at $341,842, approximately $262 per square foot. 5715 Maple St is a home located in Johnson County with nearby schools including Rushton Elementary School, Hocker Grove Middle School, and Shawnee Mission North High School.
Ownership History
Date
Name
Owned For
Owner Type
Purchase Details
Closed on
Feb 20, 2004
Sold by
Albright Dennis L and Lewis Linda N
Bought by
Albright Dennis L and Lewis Linda N
Current Estimated Value
Create a Home Valuation Report for This Property
The Home Valuation Report is an in-depth analysis detailing your home's value as well as a comparison with similar homes in the area
Home Values in the Area
Average Home Value in this Area
Purchase History
| Date | Buyer | Sale Price | Title Company |
|---|---|---|---|
| Albright Dennis L | -- | -- |
Source: Public Records
Tax History
| Year | Tax Paid | Tax Assessment Tax Assessment Total Assessment is a certain percentage of the fair market value that is determined by local assessors to be the total taxable value of land and additions on the property. | Land | Improvement |
|---|---|---|---|---|
| 2025 | $4,171 | $37,352 | $8,320 | $29,032 |
| 2024 | $4,171 | $33,580 | $8,320 | $25,260 |
| 2023 | $4,050 | $31,924 | $7,559 | $24,365 |
| 2022 | $3,681 | $29,233 | $6,870 | $22,363 |
| 2021 | $3,429 | $25,622 | $5,729 | $19,893 |
| 2020 | $3,180 | $23,115 | $4,981 | $18,134 |
| 2019 | $2,969 | $21,275 | $3,321 | $17,954 |
| 2018 | $2,876 | $20,286 | $3,321 | $16,965 |
| 2017 | $2,576 | $17,537 | $3,321 | $14,216 |
| 2016 | $2,408 | $15,985 | $3,321 | $12,664 |
| 2015 | $2,299 | $15,180 | $3,321 | $11,859 |
| 2013 | -- | $14,596 | $3,321 | $11,275 |
Source: Public Records
Map
Nearby Homes
- 5401 W 58th St
- 5212 W 57th Terrace
- 5539 Maple St
- 4986 W 60th Terrace
- 5630 Beverly Ln
- 5806 Horton St
- 5431 Dearborn St
- 5107 Rock Creek Ln
- 5525 Horton St
- 6026 W 54th Terrace
- 5645 Russell St
- 4819 W 55th St
- 5312 Reeds Rd
- 5600 Roe Blvd
- 5501 Roe Ave
- 5327 Rosewood St
- 5513 W 53rd St
- 5700 Walmer St
- 6204 W 61st Terrace
- 5613 Riggs St
Your Personal Tour Guide
Ask me questions while you tour the home.