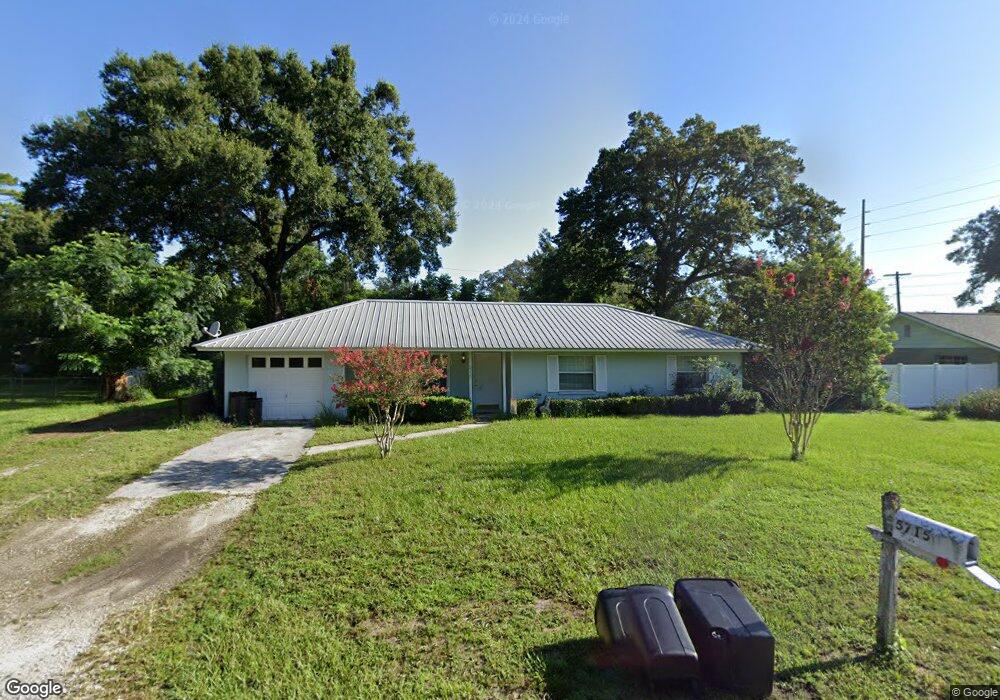
5715 SE 2nd Place Ocala, FL 34480
Silver Spring Shores NeighborhoodEstimated Value: $182,000 - $263,000
3
Beds
2
Baths
1,172
Sq Ft
$186/Sq Ft
Est. Value
About This Home
This home is located at 5715 SE 2nd Place, Ocala, FL 34480 and is currently estimated at $217,559, approximately $185 per square foot. 5715 SE 2nd Place is a home located in Marion County with nearby schools including Ward-Highlands Elementary School, Fort King Middle School, and Forest High School.
Ownership History
Date
Name
Owned For
Owner Type
Purchase Details
Closed on
Dec 22, 2014
Sold by
Mckinney Gerald W and Koon Twila B
Bought by
G & T Dime 5715 Llc
Current Estimated Value
Purchase Details
Closed on
May 25, 2004
Sold by
Koon Twila
Bought by
Koon Twila B and Mckinney Gerald W
Purchase Details
Closed on
Apr 14, 2004
Sold by
Barinco Properties Inc
Bought by
Koon Twila
Purchase Details
Closed on
Jan 3, 2003
Sold by
Burke Thomas and Burke Antoniette
Bought by
Barinco Properties Inc
Home Financials for this Owner
Home Financials are based on the most recent Mortgage that was taken out on this home.
Original Mortgage
$64,800
Interest Rate
6.16%
Purchase Details
Closed on
Sep 20, 2000
Sold by
Mckain Joseph Patrick
Bought by
Burke Thomas and Burke Antoniette
Home Financials for this Owner
Home Financials are based on the most recent Mortgage that was taken out on this home.
Original Mortgage
$65,450
Interest Rate
12.2%
Purchase Details
Closed on
Jun 2, 2000
Sold by
Mckain Joseph M
Bought by
Mckain Joseph Patrick
Create a Home Valuation Report for This Property
The Home Valuation Report is an in-depth analysis detailing your home's value as well as a comparison with similar homes in the area
Home Values in the Area
Average Home Value in this Area
Purchase History
| Date | Buyer | Sale Price | Title Company |
|---|---|---|---|
| G & T Dime 5715 Llc | -- | None Available | |
| Koon Twila B | -- | -- | |
| Koon Twila | $80,000 | Affilliated Title | |
| Barinco Properties Inc | $65,000 | Affiliated Title Of Marion C | |
| Burke Thomas | $77,000 | All American Land Title Insu | |
| Mckain Joseph Patrick | -- | -- |
Source: Public Records
Mortgage History
| Date | Status | Borrower | Loan Amount |
|---|---|---|---|
| Previous Owner | Barinco Properties Inc | $64,800 | |
| Previous Owner | Burke Thomas | $65,450 | |
| Closed | Burke Thomas | $11,550 |
Source: Public Records
Tax History
| Year | Tax Paid | Tax Assessment Tax Assessment Total Assessment is a certain percentage of the fair market value that is determined by local assessors to be the total taxable value of land and additions on the property. | Land | Improvement |
|---|---|---|---|---|
| 2025 | $2,709 | $124,637 | -- | -- |
| 2024 | $2,375 | $113,306 | -- | -- |
| 2023 | $2,274 | $103,005 | $0 | $0 |
| 2022 | $2,117 | $93,641 | $0 | $0 |
| 2021 | $1,739 | $91,472 | $14,025 | $77,447 |
| 2020 | $1,579 | $77,389 | $13,175 | $64,214 |
| 2019 | $1,515 | $72,745 | $10,200 | $62,545 |
| 2018 | $1,389 | $68,116 | $10,200 | $57,916 |
| 2017 | $1,314 | $63,235 | $8,500 | $54,735 |
| 2016 | $1,268 | $60,209 | $0 | $0 |
| 2015 | $1,177 | $54,735 | $0 | $0 |
| 2014 | $1,102 | $52,925 | $0 | $0 |
Source: Public Records
Map
Nearby Homes
- 5701 SE 2nd Place
- 5724 SE 2nd St
- 0 NW 55 Ave Unit MFROM709829
- 0 SW 55 Ave Rd Unit MFROM714632
- 5521 SE 2nd St
- 165 NE 55th Ave
- 244 SE 54th Ct
- 5520 NE 2nd Ln
- 261 SE 58th Ave
- 645 SE 56th Ave
- 5930 SE 5th Place
- 5990 SE 5th Place
- 725 SE 56th Ave
- 5320 NE 2nd Ln
- 5320 SE 4th Place
- TBD NE 56th Ct
- 5210 E Fort King St
- 5561 NE 5th Place
- 5700 NE 6th Place
- 60 NE 52nd Ave
- 5725 SE 2nd Place
- 5705 SE 2nd Place
- 5714 SE 2nd St
- 5714 SE 2nd Place
- 5704 SE 2nd Place
- 5724 SE 2nd Place
- 5700 SE 2nd Place
- 5715 SE 2nd St
- 5715 SE 3rd Place
- 5725 SE 2nd St
- 5725 SE 3rd Place
- 5705 SE 2nd St
- 5705 SE 3rd Place
- 5641 SE 2nd Place
- 5640 SE 2nd St
- 5795 SE 3rd Place
- 5775 SE 2nd St
- 5701 SE 3rd Place
- 5640 SE 2nd Place
- 5710 E Fort King St
Your Personal Tour Guide
Ask me questions while you tour the home.