Estimated Value: $475,853 - $648,000
--
Bed
--
Bath
2,488
Sq Ft
$229/Sq Ft
Est. Value
About This Home
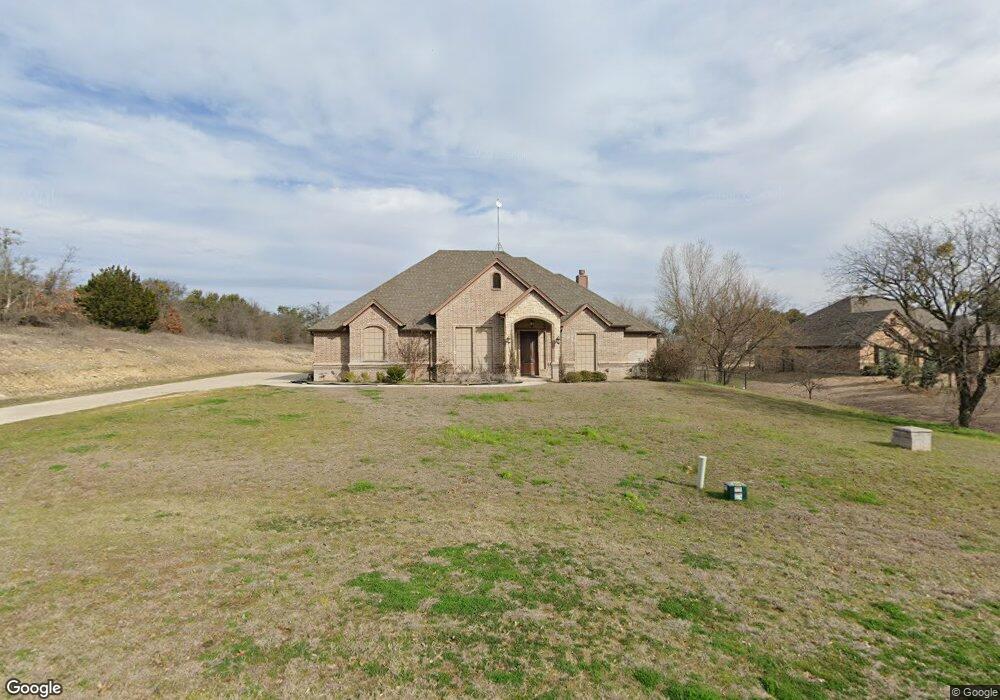
This home is located at 5716 Maple Valley Dr, Azle, TX 76020 and is currently estimated at $570,713, approximately $229 per square foot. 5716 Maple Valley Dr is a home with nearby schools including Silver Creek Elementary School, Azle Elementary School, and Azle Junior High School.
Ownership History
Date
Name
Owned For
Owner Type
Purchase Details
Closed on
Jun 25, 2010
Sold by
Royal Crest Custom Homes Ltd
Bought by
Randel Christopher N
Current Estimated Value
Home Financials for this Owner
Home Financials are based on the most recent Mortgage that was taken out on this home.
Original Mortgage
$235,603
Outstanding Balance
$156,344
Interest Rate
4.77%
Mortgage Type
FHA
Estimated Equity
$414,369
Purchase Details
Closed on
Jan 27, 2010
Sold by
Pecan Valley Developers Ltd
Bought by
Randel Christopher N
Home Financials for this Owner
Home Financials are based on the most recent Mortgage that was taken out on this home.
Original Mortgage
$190,000
Interest Rate
5.08%
Mortgage Type
Construction
Purchase Details
Closed on
Oct 20, 2006
Sold by
Peter Paulsen Properties Ltd
Bought by
Randel Christopher N
Purchase Details
Closed on
Mar 23, 2005
Bought by
Randel Christopher N
Create a Home Valuation Report for This Property
The Home Valuation Report is an in-depth analysis detailing your home's value as well as a comparison with similar homes in the area
Home Values in the Area
Average Home Value in this Area
Purchase History
| Date | Buyer | Sale Price | Title Company |
|---|---|---|---|
| Randel Christopher N | -- | Sendera Title | |
| Randel Christopher N | -- | -- | |
| Royal Crest Custom Homes Ltd | -- | Sendera Title | |
| Randel Christopher N | -- | -- | |
| Randel Christopher N | -- | -- |
Source: Public Records
Mortgage History
| Date | Status | Borrower | Loan Amount |
|---|---|---|---|
| Open | Randel Christopher N | $235,603 | |
| Previous Owner | Royal Crest Custom Homes Ltd | $190,000 |
Source: Public Records
Tax History Compared to Growth
Tax History
| Year | Tax Paid | Tax Assessment Tax Assessment Total Assessment is a certain percentage of the fair market value that is determined by local assessors to be the total taxable value of land and additions on the property. | Land | Improvement |
|---|---|---|---|---|
| 2025 | $2,367 | $482,766 | -- | -- |
| 2024 | $2,367 | $438,878 | -- | -- |
| 2023 | $2,367 | $398,980 | $0 | $0 |
| 2022 | $6,712 | $370,070 | $40,000 | $330,070 |
| 2021 | $6,393 | $370,070 | $40,000 | $330,070 |
| 2020 | $5,780 | $299,760 | $40,000 | $259,760 |
| 2019 | $6,126 | $299,760 | $40,000 | $259,760 |
| 2018 | $6,226 | $303,670 | $40,000 | $263,670 |
| 2017 | $5,515 | $303,670 | $40,000 | $263,670 |
| 2016 | $5,014 | $256,630 | $40,000 | $216,630 |
| 2015 | $1,848 | $256,630 | $40,000 | $216,630 |
| 2014 | $4,736 | $252,560 | $40,000 | $212,560 |
Source: Public Records
Map
Nearby Homes
- 2960 Flat Rock Rd
- 13041 Stacey Valley Dr
- 2016 Adams Ln S
- 255 Chaparrals Run
- 422 Collum View
- 412 Collum View
- 1700 Adams Ln
- 528 Mill Creek Ct
- 918 Boling Ranch Rd
- 101 Deer Crossing Way
- 145 Ranch Creek Dr
- 1508 Red Oak Cir
- 1922 Walter Smith Rd
- 1917 Walter Smith Rd
- 1933 Walter Smith Rd
- 1600 Flat Rock Rd
- 1055 Meadow Wood Terrace
- 742 Boling Ranch Rd
- 125 Branding Iron Ct
- 429 Hartley Way
- 5717 Maple Valley Dr
- 5725 Maple Valley Dr
- 5700 Maple Valley Dr
- 5708 Maple Valley Dr
- 5617 Maple Valley Dr
- 5624 Maple Valley Dr
- 5801 Maple Valley Dr
- 5724 Maple Valley Dr
- 5616 Maple Valley Dr
- 5808 Maple Valley Dr
- 15001 Stacey Valley Dr
- 5809 Maple Valley Dr
- 5608 Maple Valley Dr
- 2013 Adams Ln S
- 2101 Adams Ln S
- 14015 Stacey Valley Dr
- 14025 Stacey Valley Dr
- 3000 Flat Rock Rd
- 2950 Flat Rock Rd
- 5817 Maple Valley Dr