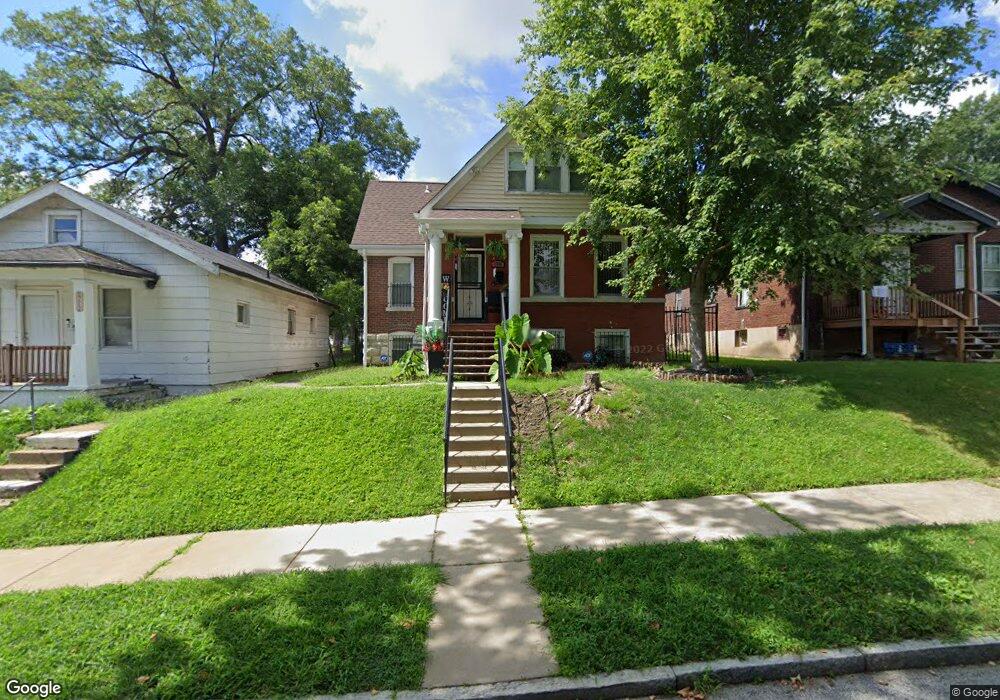
5716 Saloma Ave Saint Louis, MO 63120
Walnut Park East NeighborhoodEstimated Value: $44,000 - $62,000
--
Bed
1
Bath
2,244
Sq Ft
$24/Sq Ft
Est. Value
About This Home
This home is located at 5716 Saloma Ave, Saint Louis, MO 63120 and is currently estimated at $53,251, approximately $23 per square foot. 5716 Saloma Ave is a home located in St. Louis City with nearby schools including Walbridge Elementary Community Ed., Yeatman-Liddell Middle School, and Vashon High School.
Ownership History
Date
Name
Owned For
Owner Type
Purchase Details
Closed on
Jun 14, 2016
Sold by
Land Reutilization Authority Of The City
Bought by
Riverview West Florissant Development Co
Current Estimated Value
Purchase Details
Closed on
Jun 22, 2011
Sold by
Land Reutilization Authority Of The City
Bought by
Riverview West Florissant Development Co
Purchase Details
Closed on
Dec 8, 2004
Sold by
Murphy James W
Bought by
Lra
Purchase Details
Closed on
Aug 6, 1998
Sold by
Estes William J and Estes Marion E
Bought by
Houston Ray M
Home Financials for this Owner
Home Financials are based on the most recent Mortgage that was taken out on this home.
Original Mortgage
$55,000
Interest Rate
10.5%
Mortgage Type
Purchase Money Mortgage
Purchase Details
Closed on
Nov 22, 1996
Sold by
Estes Mamie L
Bought by
Estes William J
Home Financials for this Owner
Home Financials are based on the most recent Mortgage that was taken out on this home.
Original Mortgage
$36,000
Interest Rate
7.68%
Mortgage Type
Purchase Money Mortgage
Create a Home Valuation Report for This Property
The Home Valuation Report is an in-depth analysis detailing your home's value as well as a comparison with similar homes in the area
Home Values in the Area
Average Home Value in this Area
Purchase History
| Date | Buyer | Sale Price | Title Company |
|---|---|---|---|
| Riverview West Florissant Development Co | -- | None Available | |
| Riverview West Florissant Development Co | -- | None Available | |
| Lra | $3,850 | -- | |
| Houston Ray M | -- | -- | |
| Estes William J | -- | -- |
Source: Public Records
Mortgage History
| Date | Status | Borrower | Loan Amount |
|---|---|---|---|
| Previous Owner | Houston Ray M | $55,000 | |
| Previous Owner | Estes William J | $36,000 | |
| Closed | Estes William J | $24,375 |
Source: Public Records
Tax History Compared to Growth
Tax History
| Year | Tax Paid | Tax Assessment Tax Assessment Total Assessment is a certain percentage of the fair market value that is determined by local assessors to be the total taxable value of land and additions on the property. | Land | Improvement |
|---|---|---|---|---|
| 2025 | $523 | $6,100 | $1,270 | $4,830 |
| 2024 | $498 | $5,910 | $1,270 | $4,640 |
| 2023 | $498 | $5,910 | $1,270 | $4,640 |
| 2022 | $502 | $5,740 | $1,270 | $4,470 |
| 2021 | $502 | $380 | $380 | $0 |
| 2020 | $248 | $2,680 | $1,270 | $1,410 |
| 2019 | $247 | $2,680 | $1,270 | $1,410 |
| 2018 | $254 | $2,680 | $1,270 | $1,410 |
| 2017 | $250 | $2,680 | $1,270 | $1,410 |
| 2016 | $253 | $2,680 | $1,270 | $1,410 |
| 2015 | $231 | $2,680 | $1,270 | $1,410 |
| 2014 | $231 | $2,680 | $1,270 | $1,410 |
| 2013 | -- | $2,680 | $1,270 | $1,410 |
Source: Public Records
Map
Nearby Homes
- 4926 Wren Ave
- 4934 Plover Ave
- 4987 Plover Ave
- 5817 Saloma Ave
- 5052 Plover Ave
- 5030 Mimika Ave
- 5966 Sherry Ave
- 4527 Davison Ave
- 5959 Theodore Ave
- 4551 Alcott Ave
- 6148 Laura Ave
- 5935 Garesche Ave
- 6111 Lalite Ave
- 5407 Genevieve Ave
- 6060 Garesche Ave
- 5217 Alcott Ave
- 5043 Emerson Ave
- 5932 Lucille Ave
- 5422 Partridge Ave
- 6125 Garesche Ave
- 5712 Saloma Ave
- 5720 Saloma Ave
- 5722 Saloma Ave
- 4953 Wren Ave
- 5702 Saloma Ave
- 5726 Saloma Ave
- 5705 Woodland Ave
- 5730 Saloma Ave
- 5711 Woodland Ave
- 5736 Saloma Ave
- 5719 Saloma Ave
- 5723 Saloma Ave
- 5715 Saloma Ave
- 5719 Woodland Ave
- 5709 Saloma Ave
- 5742 Saloma Ave
- 5701 Saloma Ave
- 5731 Saloma Ave
- 4942 Wren Ave
- 4940 Wren Ave