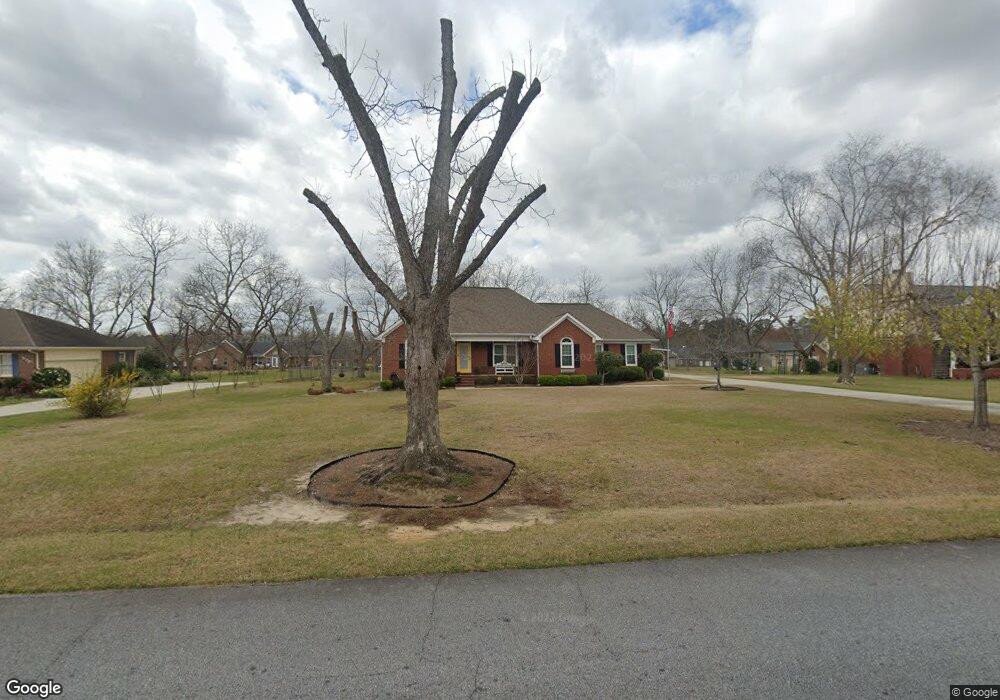
5717 School Rd Macon, GA 31216
Estimated Value: $263,000 - $288,216
3
Beds
2
Baths
2,249
Sq Ft
$122/Sq Ft
Est. Value
About This Home
This home is located at 5717 School Rd, Macon, GA 31216 and is currently estimated at $274,804, approximately $122 per square foot. 5717 School Rd is a home located in Bibb County with nearby schools including Porter Elementary School, Rutland Middle School, and Rutland High School.
Ownership History
Date
Name
Owned For
Owner Type
Purchase Details
Closed on
Aug 3, 2011
Sold by
Ingram Horace E
Bought by
Ingram Horace E and Ingram Carolyn H
Current Estimated Value
Purchase Details
Closed on
Mar 8, 2006
Sold by
Ingram Horace E
Bought by
Ingram Horace E and Ingram Carolyn H
Home Financials for this Owner
Home Financials are based on the most recent Mortgage that was taken out on this home.
Original Mortgage
$136,730
Outstanding Balance
$76,488
Interest Rate
6.19%
Mortgage Type
New Conventional
Estimated Equity
$198,316
Purchase Details
Closed on
Sep 26, 1997
Create a Home Valuation Report for This Property
The Home Valuation Report is an in-depth analysis detailing your home's value as well as a comparison with similar homes in the area
Purchase History
| Date | Buyer | Sale Price | Title Company |
|---|---|---|---|
| Ingram Horace E | -- | None Available | |
| Ingram Horace E | -- | None Avilebel | |
| -- | $140,000 | -- |
Source: Public Records
Mortgage History
| Date | Status | Borrower | Loan Amount |
|---|---|---|---|
| Open | Ingram Horace E | $136,730 |
Source: Public Records
Tax History
| Year | Tax Paid | Tax Assessment Tax Assessment Total Assessment is a certain percentage of the fair market value that is determined by local assessors to be the total taxable value of land and additions on the property. | Land | Improvement |
|---|---|---|---|---|
| 2025 | $2,269 | $106,926 | $12,000 | $94,926 |
| 2024 | $2,325 | $106,030 | $12,000 | $94,030 |
| 2023 | $1,651 | $97,474 | $10,000 | $87,474 |
| 2022 | $2,353 | $81,871 | $10,000 | $71,871 |
| 2021 | $1,969 | $65,672 | $10,000 | $55,672 |
| 2020 | $2,012 | $65,672 | $10,000 | $55,672 |
| 2019 | $2,027 | $65,672 | $10,000 | $55,672 |
| 2018 | $3,533 | $62,927 | $10,000 | $52,927 |
| 2017 | $2,095 | $62,927 | $10,000 | $52,927 |
| 2016 | $1,935 | $62,927 | $10,000 | $52,927 |
| 2015 | $2,739 | $62,927 | $10,000 | $52,927 |
| 2014 | $2,806 | $64,196 | $11,268 | $52,927 |
Source: Public Records
Map
Nearby Homes
- 106 Hudson Way
- 122 Hudson Way
- 5608 Swymer Dr
- 123 Hudson Way
- 3906 Hartley Bridge Rd
- 3491 Sandy Cir
- 3636 Bonanza Dr
- 3720 Dean Dr
- 3708 Jones Rd
- 6233 Skipperton Rd
- 109 Oakview Club Dr
- 3533 Bridgewood Dr
- 308 Ellis Ct
- 361 Thoroughbred Ln
- 219 Trenton Terrace
- 5514 Bankston Lake Rd
- 5524 Bankston Lake Rd
- 180 Ridge Cir
- 221 Pendleton Ct
- 4202 Cyndy Jo Cir
Your Personal Tour Guide
Ask me questions while you tour the home.