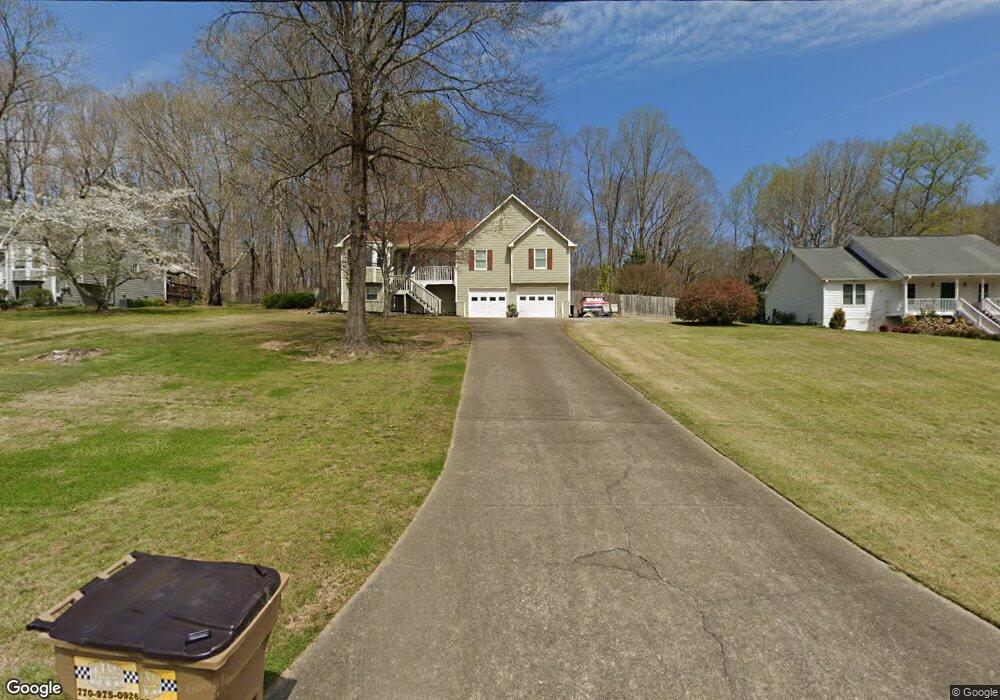
5718 E Emerald Oaks Dr Acworth, GA 30102
Oak Grove NeighborhoodEstimated Value: $382,429 - $419,000
3
Beds
2
Baths
1,830
Sq Ft
$219/Sq Ft
Est. Value
About This Home
This home is located at 5718 E Emerald Oaks Dr, Acworth, GA 30102 and is currently estimated at $400,715, approximately $218 per square foot. 5718 E Emerald Oaks Dr is a home located in Cherokee County with nearby schools including E. T. Booth Middle School, Etowah High School, and North Cobb Christian School.
Ownership History
Date
Name
Owned For
Owner Type
Purchase Details
Closed on
Apr 30, 2019
Sold by
Albright Steven J
Bought by
Dimmock James E
Current Estimated Value
Home Financials for this Owner
Home Financials are based on the most recent Mortgage that was taken out on this home.
Original Mortgage
$229,761
Outstanding Balance
$200,328
Interest Rate
4%
Mortgage Type
FHA
Estimated Equity
$200,387
Purchase Details
Closed on
Sep 19, 2016
Sold by
Steven J
Bought by
Albright Steven J and Albright Kristina
Home Financials for this Owner
Home Financials are based on the most recent Mortgage that was taken out on this home.
Original Mortgage
$127,000
Interest Rate
3.43%
Purchase Details
Closed on
May 31, 2007
Sold by
Gregory Larry W and Gregory Carla
Bought by
Albright Steven J
Home Financials for this Owner
Home Financials are based on the most recent Mortgage that was taken out on this home.
Original Mortgage
$143,150
Interest Rate
6.16%
Create a Home Valuation Report for This Property
The Home Valuation Report is an in-depth analysis detailing your home's value as well as a comparison with similar homes in the area
Home Values in the Area
Average Home Value in this Area
Purchase History
| Date | Buyer | Sale Price | Title Company |
|---|---|---|---|
| Dimmock James E | $234,000 | -- | |
| Albright Steven J | -- | -- | |
| Albright Steven J | $143,200 | -- |
Source: Public Records
Mortgage History
| Date | Status | Borrower | Loan Amount |
|---|---|---|---|
| Open | Dimmock James E | $229,761 | |
| Previous Owner | Albright Steven J | $127,000 | |
| Previous Owner | Albright Steven J | $143,150 |
Source: Public Records
Tax History Compared to Growth
Tax History
| Year | Tax Paid | Tax Assessment Tax Assessment Total Assessment is a certain percentage of the fair market value that is determined by local assessors to be the total taxable value of land and additions on the property. | Land | Improvement |
|---|---|---|---|---|
| 2025 | $3,248 | $139,820 | $24,000 | $115,820 |
| 2024 | $3,275 | $142,220 | $24,000 | $118,220 |
| 2023 | $2,927 | $146,324 | $24,000 | $122,324 |
| 2022 | $2,782 | $117,228 | $24,000 | $93,228 |
| 2021 | $2,481 | $94,208 | $16,000 | $78,208 |
| 2020 | $2,377 | $89,672 | $16,000 | $73,672 |
| 2019 | $1,873 | $69,000 | $14,000 | $55,000 |
| 2018 | $1,728 | $62,720 | $14,000 | $48,720 |
| 2017 | $1,581 | $155,100 | $14,000 | $48,040 |
| 2016 | $1,581 | $141,500 | $14,000 | $42,600 |
| 2015 | $1,355 | $121,000 | $11,600 | $36,800 |
| 2014 | $1,372 | $122,200 | $11,600 | $37,280 |
Source: Public Records
Map
Nearby Homes
- 0 E Emerald Oaks Dr Unit 10591658
- 3487 Kellogg Creek Rd
- 2279 Highway 92
- 3500 Twin Pines Dr
- 3470 Hill Ln
- 3332 Hunt Rd
- 3720 James Rd
- 5900 Jacobs Rd
- 5767 James Rd
- 0 Highway 92 Unit 5623819
- 0 Highway 92 Unit 8844996
- 0 Highway 92 Unit 182 10271736
- 3290 Elwin Ragsdale Way
- 3019 Westwood Dr
- 135 Boones Ridge Pkwy SE
- 0 Jacobs Rd SE Unit 7534888
- 10 Mariner Way SE
- 144 Boones Ridge Pkwy SE
- 2936 Cheryl Ct
- 5714 E Emerald Oaks Dr
- 0 E Emerald Oaks Dr Unit 10273492
- 0 E Emerald Oaks Dr Unit 9023139
- 0 E Emerald Oaks Dr Unit 7483810
- 5720 E Emerald Oaks Dr
- - E Emerald Oaks Dr
- 00 E Emerald Oaks Dr
- E E Emerald Oaks Dr
- 5715 E Emerald Oaks Dr
- 5719 E Emerald Oaks Dr
- 5725 E Emerald Oaks Dr
- 5721 E Emerald Oaks Dr
- 5711 E Emerald Oaks Dr
- 5757 E Emerald Oaks Ln
- 3501 Kellogg Creek Rd
- 5709 E Emerald Oaks Dr
- 3503 Kellogg Creek Rd
- 5754 E Emerald Oaks Ln
- 5705 E Emerald Oaks Dr
- 5705 E Emerald Oaks Dr Unit 5705