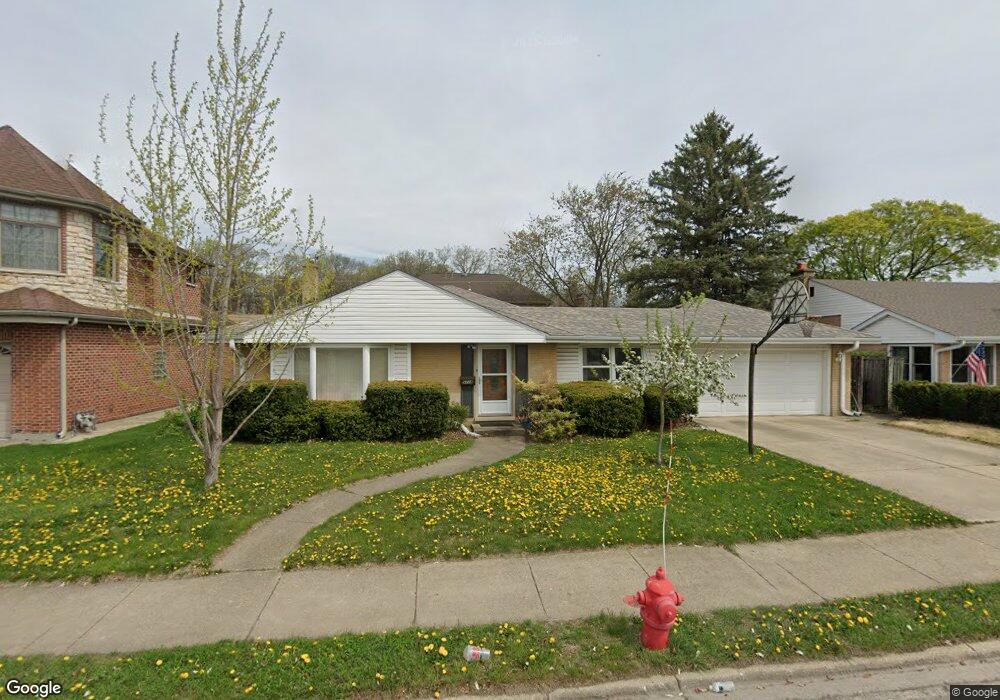
5718 Emerson St Morton Grove, IL 60053
Estimated Value: $341,668 - $442,000
3
Beds
2
Baths
1,314
Sq Ft
$307/Sq Ft
Est. Value
About This Home
This home is located at 5718 Emerson St, Morton Grove, IL 60053 and is currently estimated at $403,667, approximately $307 per square foot. 5718 Emerson St is a home located in Cook County with nearby schools including Hynes Elementary School, Golf Middle School, and Niles North High School.
Ownership History
Date
Name
Owned For
Owner Type
Purchase Details
Closed on
Dec 29, 2006
Sold by
Plamoottil George and Plamoottil Raji
Bought by
Shraybman Yevgeniy and Shraybman Cielito
Current Estimated Value
Home Financials for this Owner
Home Financials are based on the most recent Mortgage that was taken out on this home.
Original Mortgage
$300,000
Outstanding Balance
$178,780
Interest Rate
6.16%
Mortgage Type
New Conventional
Estimated Equity
$224,887
Purchase Details
Closed on
Aug 4, 1998
Sold by
Lalu Mathew George and Lalu Mathew
Bought by
Plamoottil George and Plamoottil Raji
Home Financials for this Owner
Home Financials are based on the most recent Mortgage that was taken out on this home.
Original Mortgage
$158,250
Interest Rate
7.06%
Purchase Details
Closed on
Aug 20, 1997
Sold by
Lalu Mathew George and Lalu Mathew
Bought by
Lalu Mathew George and Lalu Mathew
Create a Home Valuation Report for This Property
The Home Valuation Report is an in-depth analysis detailing your home's value as well as a comparison with similar homes in the area
Home Values in the Area
Average Home Value in this Area
Purchase History
| Date | Buyer | Sale Price | Title Company |
|---|---|---|---|
| Shraybman Yevgeniy | $375,000 | First American Title Ins Co | |
| Plamoottil George | $211,000 | Centennial Title Incorporate | |
| Lalu Mathew George | -- | -- |
Source: Public Records
Mortgage History
| Date | Status | Borrower | Loan Amount |
|---|---|---|---|
| Open | Shraybman Yevgeniy | $300,000 | |
| Previous Owner | Plamoottil George | $158,250 |
Source: Public Records
Tax History Compared to Growth
Tax History
| Year | Tax Paid | Tax Assessment Tax Assessment Total Assessment is a certain percentage of the fair market value that is determined by local assessors to be the total taxable value of land and additions on the property. | Land | Improvement |
|---|---|---|---|---|
| 2024 | $933 | $3,560 | $1,365 | $2,195 |
| 2023 | $886 | $3,560 | $1,365 | $2,195 |
| 2022 | $886 | $3,560 | $1,365 | $2,195 |
| 2021 | $692 | $2,491 | $840 | $1,651 |
| 2020 | $681 | $2,491 | $840 | $1,651 |
| 2019 | $682 | $2,779 | $840 | $1,939 |
| 2018 | $757 | $2,742 | $761 | $1,981 |
| 2017 | $764 | $2,742 | $761 | $1,981 |
| 2016 | $747 | $2,742 | $761 | $1,981 |
| 2015 | $652 | $2,285 | $656 | $1,629 |
| 2014 | $653 | $2,285 | $656 | $1,629 |
| 2013 | $665 | $2,377 | $656 | $1,721 |
Source: Public Records
Map
Nearby Homes
- 5644 Lyons St
- 9320 Menard Ave
- 9314 Menard Ave
- 9224 Menard Ave
- 9234 Central Ave
- 5449 Arcadia St
- 9539 Lorel Ave
- 8918 Parkside Ave
- 5536 Greenwood St
- 9655 Woods Dr Unit P350
- 9655 Woods Dr Unit 1809
- 9715 Woods Dr Unit 903
- 9715 Woods Dr Unit 1104
- 8841 Menard Ave
- 9725 Woods Dr Unit 1913
- 9725 Woods Dr Unit 309
- 9725 Woods Dr Unit 802
- 9725 Woods Dr Unit 2015
- 5459 Suffield Ct
- 8836 Mansfield Ave
- 5718 Emerson St
- 5724 Emerson St
- 5724 Emerson St
- 5712 Emerson St
- 5712 Emerson St
- 5717 Emerson St
- 5711 Emerson St
- 5723 Emerson St
- 5717 Capri Ln
- 5730 Emerson St
- 5706 Emerson St
- 5723 Capri Ln
- 5711 Capri Ln
- 5707 Emerson St
- 5729 Emerson St
- 5729 Capri Ln
- 5707 Capri Ln
- 5736 Emerson St
- 5736 Emerson St
- 5700 Emerson St