5718 Sandy View Dr Columbus, GA 31907
East Columbus NeighborhoodEstimated Value: $187,000 - $219,000
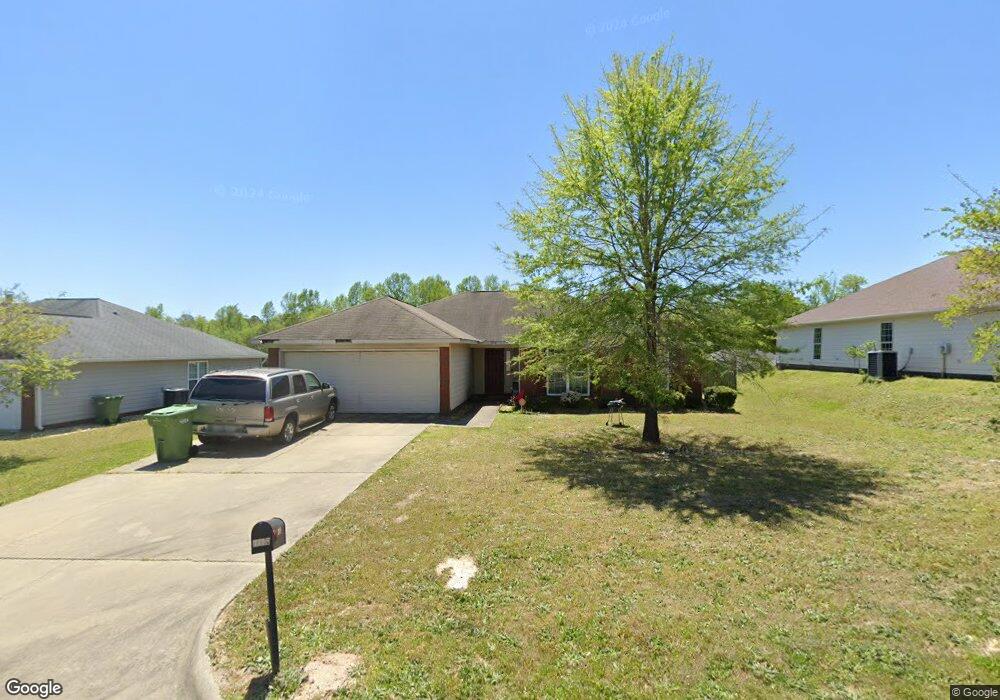
About This Home
This home is located at 5718 Sandy View Dr, Columbus, GA 31907 and is currently estimated at $205,905, approximately $118 per square foot. 5718 Sandy View Dr is a home located in Muscogee County with nearby schools including Georgetown Elementary School, East Columbus Magnet Academy, and Kendrick High School.
Ownership History
We collect this data history from publicly available records. To have your information removed, we recommend requesting removal directly through your county’s website.
Purchase Details
Home Financials for this Owner
Home Financials are based on the most recent Mortgage that was taken out on this home.Purchase Details
Purchase Details
Home Financials for this Owner
Home Financials are based on the most recent Mortgage that was taken out on this home.Home Values in the Area
Average Home Value in this Area
Purchase History
We collect this data history from publicly available records. To have your information removed, we recommend requesting removal directly through your county’s website.
| Date | Buyer | Sale Price | Title Company |
|---|---|---|---|
| $99,900 | -- | ||
| $145,415 | -- | ||
| $145,415 | -- | ||
| $160,900 | None Available |
Mortgage History
We collect this data history from publicly available records. To have your information removed, we recommend requesting removal directly through your county’s website.
| Date | Status | Borrower | Loan Amount |
|---|---|---|---|
| Open | $95,543 | ||
| Closed | $5,000 | ||
| Previous Owner | $164,359 |
Tax History
We collect this data history from publicly available records. To have your information removed, we recommend requesting removal directly through your county’s website.
| Year | Tax Paid | Tax Assessment Tax Assessment Total Assessment is a certain percentage of the fair market value that is determined by local assessors to be the total taxable value of land and additions on the property. | Land | Improvement |
|---|---|---|---|---|
| 2025 | $1,048 | $64,852 | $8,964 | $55,888 |
| 2024 | $1,047 | $64,852 | $8,964 | $55,888 |
| 2023 | $359 | $64,852 | $8,964 | $55,888 |
| 2022 | $1,092 | $53,716 | $8,964 | $44,752 |
| 2021 | $1,085 | $52,528 | $8,964 | $43,564 |
| 2020 | $1,085 | $52,528 | $8,964 | $43,564 |
| 2019 | $1,090 | $52,528 | $8,964 | $43,564 |
| 2018 | $1,090 | $52,528 | $8,964 | $43,564 |
| 2017 | $1,096 | $52,528 | $8,964 | $43,564 |
| 2016 | $1,101 | $47,306 | $12,000 | $35,306 |
| 2015 | $1,103 | $47,306 | $12,000 | $35,306 |
| 2014 | $1,105 | $39,960 | $12,000 | $27,960 |
| 2013 | -- | $64,338 | $12,000 | $52,338 |
Map
- 5788 Sandy View Dr
- 704 Crestline Dr
- 5845 Sandy Oak Dr
- 6257 Buena Vista Rd
- 5944 Buena Vista Rd
- 738 Asa Dr
- 6644 Buena Vista Rd
- 6207 Georgetown Dr
- 732 Moye Rd
- 730 Moye Rd
- 610 Parkhill Dr
- 132 Sweetwater Dr
- 908 Arlington Dr
- 1252 School House Dr
- 5820 Georgetown Dr
- 6219 Bayberry Dr
- 6125 Valencia Dr
- 1053 Amber Dr
- 6142 Luna Dr
- 5814 Mill Branch Rd
- 5776 Sandy View Dr
- 5782 Sandy View Dr
- 5770 Sandy View Dr
- 6425 Sandy Bottom Dr
- 6431 Sandy Bottom Dr
- 6419 Sandy Bottom Dr
- 5724 Sandy View Dr
- 5724 Sandford Ave
- 2575 Sandy View Dr
- 6435 Sandy Bottom Dr
- 5737 Sandy View Dr
- 5731 Sandy View Dr
- 5743 Sandy View Dr
- 6413 Sandy Bottom Dr
- 5794 Sandy View Dr
- 5725 Sandy View Dr
- 5749 Sandy View Dr
- 6407 Sandy Bottom Dr
- 5719 Sandy View Dr
- 6439 Sandy Bottom Dr
Ask me questions while you tour the home.