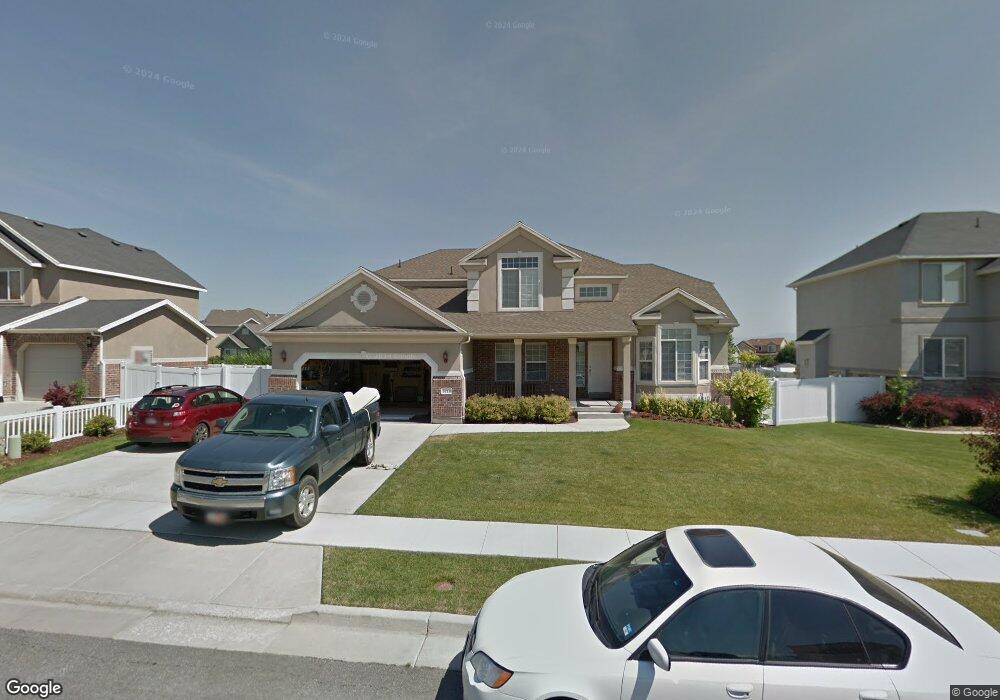
5718 W Red Narrows Dr West Jordan, UT 84081
Cobble Creek NeighborhoodEstimated Value: $692,000 - $737,000
6
Beds
4
Baths
3,923
Sq Ft
$183/Sq Ft
Est. Value
About This Home
This home is located at 5718 W Red Narrows Dr, West Jordan, UT 84081 and is currently estimated at $718,302, approximately $183 per square foot. 5718 W Red Narrows Dr is a home located in Salt Lake County with nearby schools including Hayden Peak Elementary School, West Hills Middle School, and Copper Hills High School.
Ownership History
Date
Name
Owned For
Owner Type
Purchase Details
Closed on
Mar 8, 2021
Sold by
Bills Kevin L and Bills Trina E
Bought by
Gordon Wendy Kay
Current Estimated Value
Home Financials for this Owner
Home Financials are based on the most recent Mortgage that was taken out on this home.
Original Mortgage
$335,000
Outstanding Balance
$300,304
Interest Rate
2.7%
Mortgage Type
New Conventional
Estimated Equity
$417,998
Purchase Details
Closed on
Aug 13, 2018
Sold by
Bills Kevin L and Bills Trina E
Bought by
Bills Kevin L and Bills Trina E
Purchase Details
Closed on
May 27, 2004
Sold by
Ivory Homes Ltd
Bought by
Bills Kevin L and Bills Trina E
Home Financials for this Owner
Home Financials are based on the most recent Mortgage that was taken out on this home.
Original Mortgage
$220,229
Interest Rate
5.12%
Mortgage Type
Purchase Money Mortgage
Create a Home Valuation Report for This Property
The Home Valuation Report is an in-depth analysis detailing your home's value as well as a comparison with similar homes in the area
Home Values in the Area
Average Home Value in this Area
Purchase History
| Date | Buyer | Sale Price | Title Company |
|---|---|---|---|
| Gordon Wendy Kay | -- | Cottonwood Title | |
| Bills Kevin L | -- | None Available | |
| Bills Kevin L | -- | Cottonwood Title Ins Agency |
Source: Public Records
Mortgage History
| Date | Status | Borrower | Loan Amount |
|---|---|---|---|
| Open | Gordon Wendy Kay | $335,000 | |
| Previous Owner | Bills Kevin L | $220,229 | |
| Closed | Bills Kevin L | $20,000 |
Source: Public Records
Tax History Compared to Growth
Tax History
| Year | Tax Paid | Tax Assessment Tax Assessment Total Assessment is a certain percentage of the fair market value that is determined by local assessors to be the total taxable value of land and additions on the property. | Land | Improvement |
|---|---|---|---|---|
| 2025 | $3,445 | $683,500 | $164,100 | $519,400 |
| 2024 | $3,445 | $662,800 | $159,300 | $503,500 |
| 2023 | $3,500 | $634,600 | $153,200 | $481,400 |
| 2022 | $3,637 | $648,900 | $150,200 | $498,700 |
| 2021 | $2,920 | $474,200 | $118,300 | $355,900 |
| 2020 | $2,703 | $411,900 | $118,300 | $293,600 |
| 2019 | $2,735 | $408,800 | $118,300 | $290,500 |
| 2018 | $2,595 | $384,600 | $116,400 | $268,200 |
| 2017 | $2,458 | $362,700 | $116,400 | $246,300 |
| 2016 | $2,186 | $303,100 | $113,600 | $189,500 |
| 2015 | $2,246 | $303,600 | $115,700 | $187,900 |
| 2014 | $2,038 | $271,300 | $104,900 | $166,400 |
Source: Public Records
Map
Nearby Homes
- 5946 W Eric Mountain Ln Unit 103
- 5958 W Eric Mountain Ln
- 5958 W Eric Mountain Ln Unit 104
- 8501 S Michele River Ave Unit 116
- Larsen Plan at Copperhaven by Toll Brothers
- Brooke Plan at Copperhaven by Toll Brothers
- 8453 S Windmill Dr
- 5527 W Caliente Dr
- 5582 Washoe Cove
- 8793 S Big Bar Ct
- 5958 W 8100 S
- 5422 W Island Creek Dr
- 6006 W Highlandbrook Dr
- 8854 Rocky Creek Dr
- 8368 S Oak Gate Dr
- 5298 W Icehouse Way
- 7214 S Sage Run Rd
- 8577 Autumn Gold Cir
- 8769 S 5130 W
- 5183 W Swift Water Way
- 5718 Red Narrows Dr
- 5728 Red Narrows Dr
- 5708 Red Narrows Dr
- 5728 W Red Narrows Dr
- 8431 Town View Cir
- 8433 Town View Cir
- 5738 Red Narrows Dr
- 5698 Red Narrows Dr
- 5719 Red Narrows Dr
- 5719 W Red Narrows Dr
- 8426 Shallow Creek Rd
- 5709 Red Narrows Dr
- 5709 W Red Narrows Dr
- 5731 W Red Narrows Dr
- 5731 Red Narrows Dr
- 5731 Red Narrows Dr S
- 5699 Red Narrows Dr
- 5699 W Red Narrows Dr
- 5741 Red Narrows Dr
- 8432 Town View Cir