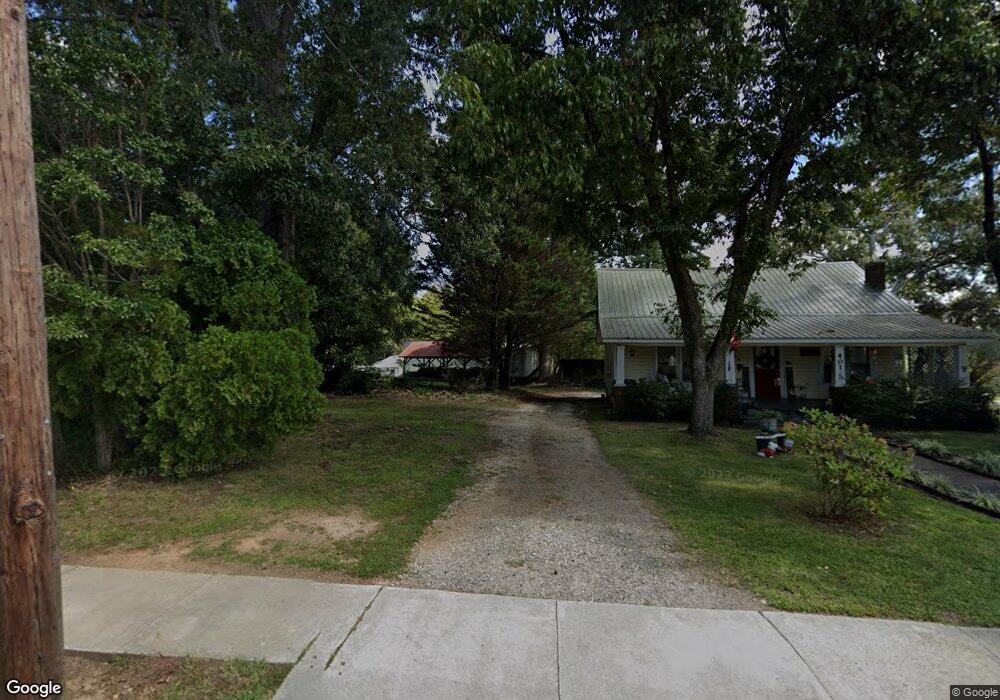
5719 Crystal Unit 19 Clermont, GA 30527
Estimated Value: $371,000 - $456,000
4
Beds
2
Baths
2,068
Sq Ft
$196/Sq Ft
Est. Value
About This Home
This home is located at 5719 Crystal Unit 19, Clermont, GA 30527 and is currently estimated at $404,543, approximately $195 per square foot. 5719 Crystal Unit 19 is a home located in Hall County with nearby schools including Wauka Mountain Elementary School, North Hall Middle School, and North Hall High School.
Ownership History
Date
Name
Owned For
Owner Type
Purchase Details
Closed on
Apr 28, 2017
Sold by
Natividad Joseph Martin
Bought by
Vinson Stephen L
Current Estimated Value
Home Financials for this Owner
Home Financials are based on the most recent Mortgage that was taken out on this home.
Original Mortgage
$211,765
Outstanding Balance
$176,302
Interest Rate
4.14%
Mortgage Type
VA
Estimated Equity
$228,241
Purchase Details
Closed on
Oct 23, 2015
Sold by
Breedlove Homes Llc
Bought by
Natividad Josehp Martin and Natividad Sherron Irene
Purchase Details
Closed on
Aug 13, 2015
Sold by
Breedlove Residential Llc
Bought by
Breed Love Homes Llc
Purchase Details
Closed on
Jun 17, 2014
Sold by
Kemp Jimmy
Bought by
Breedlove Residential Llc
Purchase Details
Closed on
Jul 15, 2011
Sold by
Habersham Bank
Bought by
Kemp Jimmy
Purchase Details
Closed on
May 4, 2010
Sold by
Rolling Hills Properties Llc
Bought by
Habersham Bank
Create a Home Valuation Report for This Property
The Home Valuation Report is an in-depth analysis detailing your home's value as well as a comparison with similar homes in the area
Home Values in the Area
Average Home Value in this Area
Purchase History
| Date | Buyer | Sale Price | Title Company |
|---|---|---|---|
| Vinson Stephen L | $205,000 | -- | |
| Natividad Josehp Martin | $167,900 | -- | |
| Breed Love Homes Llc | $100,000 | -- | |
| Breedlove Residential Llc | $588,000 | -- | |
| Kemp Jimmy | $8,800 | -- | |
| Habersham Bank | $943,700 | -- |
Source: Public Records
Mortgage History
| Date | Status | Borrower | Loan Amount |
|---|---|---|---|
| Open | Vinson Stephen L | $211,765 |
Source: Public Records
Tax History Compared to Growth
Tax History
| Year | Tax Paid | Tax Assessment Tax Assessment Total Assessment is a certain percentage of the fair market value that is determined by local assessors to be the total taxable value of land and additions on the property. | Land | Improvement |
|---|---|---|---|---|
| 2024 | $3,900 | $151,080 | $18,240 | $132,840 |
| 2023 | $3,232 | $139,560 | $18,240 | $121,320 |
| 2022 | $3,073 | $112,840 | $18,240 | $94,600 |
| 2021 | $2,562 | $91,240 | $9,120 | $82,120 |
| 2020 | $2,510 | $86,800 | $9,120 | $77,680 |
| 2019 | $2,478 | $84,920 | $4,800 | $80,120 |
| 2018 | $2,310 | $76,280 | $4,800 | $71,480 |
| 2017 | $141 | $67,920 | $4,800 | $63,120 |
| 2016 | $140 | $67,920 | $4,800 | $63,120 |
| 2015 | $232 | $3,600 | $3,600 | $0 |
| 2014 | $232 | $3,600 | $3,600 | $0 |
Source: Public Records
Map
Nearby Homes
- 5722 Crystal
- 5746 Avalon Commons Way
- 5649 Bradley Ln
- 5821 Abbey View Ct
- 5519 Cleveland Hwy
- 5231 Dahlonega Hwy
- 5812 Claybrook Ct
- 5851 Canterbury Way
- 2856 Woodbriar Dr
- 5814 Gailey Dr
- 6223 Hulsey Rd
- 6708 Clermont Hwy
- 6632 Mountain Meadow Dr
- 6310 Green Mountain Ln
- 6618 Kenimer Rd
- 5515 Riverwalk Ct
- 5352 Wild Smith Rd
- 5719 Crystal
- 5723 Crystal Unit 18
- 5723 Crystal
- 5715 Crystal Way Unit 20
- 5715 Crystal Way
- Lot 23 Crystal Way
- Lot 22 Crystal Way
- Lot 21 Crystal Way
- Lot 20 Crystal Way
- Lot 19 Crystal Way
- Lot 18 Crystal Way
- Lot 17 Crystal Way
- Lot 16 Crystal Way
- Lot 15 Crystal Way
- Lot 14 Crystal Way
- Lot 13 Crystal Way
- Lot 12 Crystal Way
- Lot 11 Crystal Way
- Lot 10 Crystal Way
- Lot 9 Crystal Way