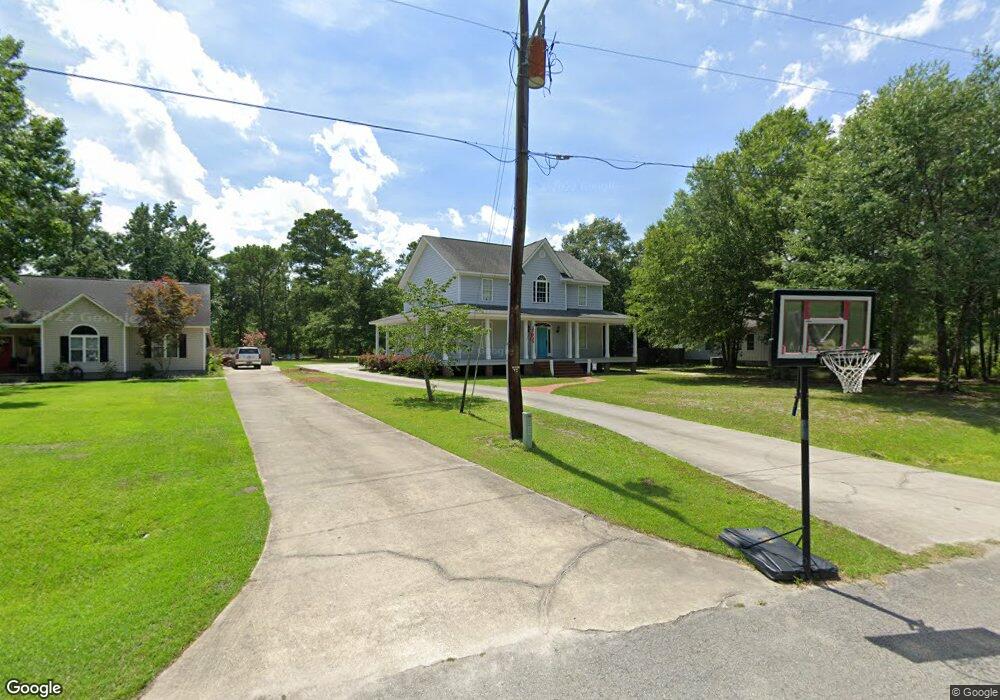
5719 Dekker Rd Castle Hayne, NC 28429
Estimated Value: $500,000 - $731,000
3
Beds
3
Baths
3,630
Sq Ft
$167/Sq Ft
Est. Value
About This Home
This home is located at 5719 Dekker Rd, Castle Hayne, NC 28429 and is currently estimated at $607,311, approximately $167 per square foot. 5719 Dekker Rd is a home located in New Hanover County with nearby schools including Castle Hayne Elementary School, Holly Shelter Middle School, and Emsley A. Laney High School.
Ownership History
Date
Name
Owned For
Owner Type
Purchase Details
Closed on
Jun 22, 2001
Sold by
Legend Builders Inc
Bought by
Murphy Randall Earl Susan C
Current Estimated Value
Purchase Details
Closed on
Sep 19, 2000
Sold by
Stoneybrook Inc
Bought by
Legend Builders Inc
Purchase Details
Closed on
Jun 20, 1996
Sold by
Stocks Jack G
Bought by
Stoneybrook Inc
Purchase Details
Closed on
Jun 13, 1996
Sold by
Stocks Jack G
Bought by
Stoneybrook Inc
Purchase Details
Closed on
Jul 26, 1994
Sold by
Bb
Bought by
Stocks Jack G
Purchase Details
Closed on
Aug 13, 1993
Sold by
Carolina Savings Bank
Bought by
Bb
Purchase Details
Closed on
Jan 6, 1993
Sold by
Huffine David E Sub Tr
Bought by
Carolina Savings Bank
Purchase Details
Closed on
Dec 1, 1985
Sold by
Landmark Properties
Bought by
Sanders Nathan S Judia B
Create a Home Valuation Report for This Property
The Home Valuation Report is an in-depth analysis detailing your home's value as well as a comparison with similar homes in the area
Home Values in the Area
Average Home Value in this Area
Purchase History
| Date | Buyer | Sale Price | Title Company |
|---|---|---|---|
| Murphy Randall Earl Susan C | $25,500 | -- | |
| Legend Builders Inc | $100,000 | -- | |
| Stoneybrook Inc | $225,000 | -- | |
| Stoneybrook Inc | $225,000 | -- | |
| Stocks Jack G | $75,000 | -- | |
| Bb | -- | -- | |
| Carolina Savings Bank | $320,000 | -- | |
| Sanders Nathan S Judia B | $103,000 | -- |
Source: Public Records
Tax History
| Year | Tax Paid | Tax Assessment Tax Assessment Total Assessment is a certain percentage of the fair market value that is determined by local assessors to be the total taxable value of land and additions on the property. | Land | Improvement |
|---|---|---|---|---|
| 2025 | $2,261 | $577,800 | $148,200 | $429,600 |
| 2023 | $2,650 | $494,200 | $72,300 | $421,900 |
| 2022 | $2,675 | $494,200 | $72,300 | $421,900 |
| 2021 | $2,718 | $494,200 | $72,300 | $421,900 |
| 2020 | $1,927 | $304,700 | $46,200 | $258,500 |
| 2019 | $1,927 | $304,700 | $46,200 | $258,500 |
| 2018 | $1,927 | $304,700 | $46,200 | $258,500 |
| 2017 | $1,973 | $304,700 | $46,200 | $258,500 |
| 2016 | $1,848 | $266,700 | $46,200 | $220,500 |
| 2015 | $1,718 | $266,700 | $46,200 | $220,500 |
| 2014 | $1,688 | $266,700 | $46,200 | $220,500 |
Source: Public Records
Map
Nearby Homes
- 119 McDougald Dr
- 5917 Dekker Rd
- 4121 Castle Hayne Rd
- 4499 Parsons Mill Dr
- 697 Jenoa Loop
- 662 Jenoa Loop
- 656 Jenoa Dr
- 4516 Castle Hayne Rd
- 3629 Excelsior Ln
- 225 Hermitage Rd
- 3506 Dutton Dr
- 3607 Minerva Ln
- 3524 Castle Hayne Rd
- 3622 Rosewood Landing Dr
- 3605 Rosewood Landing Dr
- 409 Old Forest Dr
- 3604 Haughton Ln
- 3500 Dutton Dr
- 410 Old Forest Dr
- 409 Cornubia Dr
Your Personal Tour Guide
Ask me questions while you tour the home.