Estimated Value: $212,000 - $271,000
2
Beds
2
Baths
943
Sq Ft
$261/Sq Ft
Est. Value
About This Home
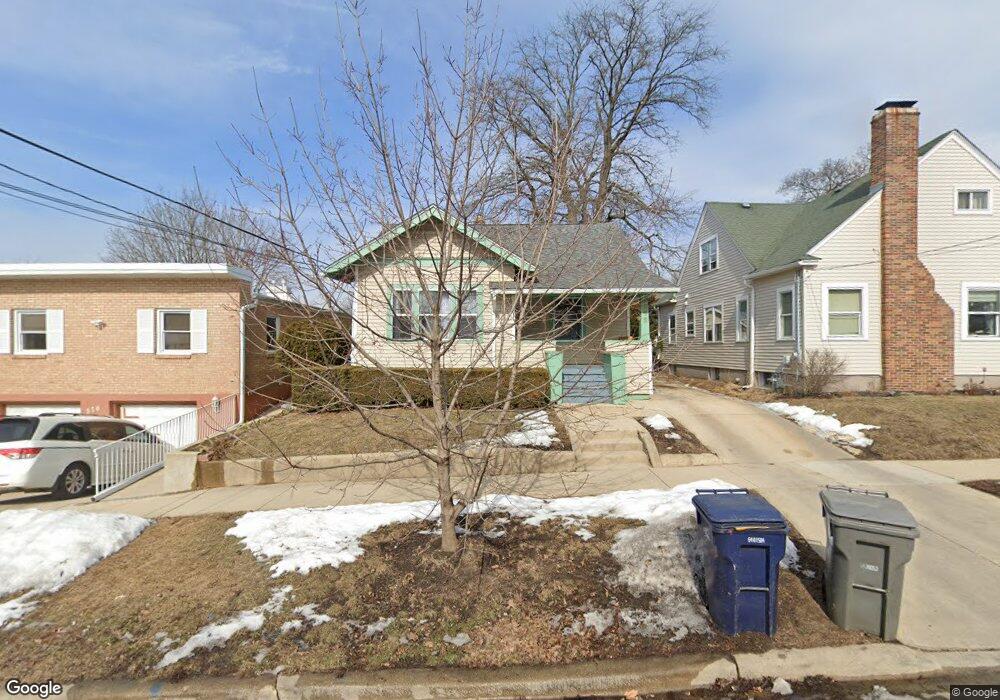
This home is located at 572 Barrett St, Elgin, IL 60120 and is currently estimated at $245,689, approximately $260 per square foot. 572 Barrett St is a home located in Kane County with nearby schools including Huff Elementary School, Ellis Middle School, and Elgin High School.
Ownership History
Date
Name
Owned For
Owner Type
Purchase Details
Closed on
Dec 27, 2002
Sold by
Arce Ines
Bought by
Aguilera Jose
Current Estimated Value
Home Financials for this Owner
Home Financials are based on the most recent Mortgage that was taken out on this home.
Original Mortgage
$148,667
Interest Rate
6.07%
Purchase Details
Closed on
Apr 17, 2002
Sold by
Itasca Bank & Trust Co
Bought by
Arce Ines
Home Financials for this Owner
Home Financials are based on the most recent Mortgage that was taken out on this home.
Original Mortgage
$118,750
Interest Rate
6.62%
Purchase Details
Closed on
May 5, 2001
Sold by
Sowers Alfreda L
Bought by
Itasca Bank & Trust Co and Trust #11877
Purchase Details
Closed on
Dec 1, 1994
Sold by
Serrano M Carmen and Deleon Martha Diaz
Bought by
Sowers Alfreda L
Home Financials for this Owner
Home Financials are based on the most recent Mortgage that was taken out on this home.
Original Mortgage
$78,630
Interest Rate
9.27%
Mortgage Type
FHA
Create a Home Valuation Report for This Property
The Home Valuation Report is an in-depth analysis detailing your home's value as well as a comparison with similar homes in the area
Home Values in the Area
Average Home Value in this Area
Purchase History
| Date | Buyer | Sale Price | Title Company |
|---|---|---|---|
| Aguilera Jose | $151,000 | Multiple | |
| Arce Ines | $125,000 | Greater Illinois Title Compa | |
| Itasca Bank & Trust Co | -- | -- | |
| Sowers Alfreda L | $79,500 | Chicago Title Insurance Co |
Source: Public Records
Mortgage History
| Date | Status | Borrower | Loan Amount |
|---|---|---|---|
| Previous Owner | Aguilera Jose | $148,667 | |
| Previous Owner | Arce Ines | $118,750 | |
| Previous Owner | Sowers Alfreda L | $78,630 |
Source: Public Records
Tax History Compared to Growth
Tax History
| Year | Tax Paid | Tax Assessment Tax Assessment Total Assessment is a certain percentage of the fair market value that is determined by local assessors to be the total taxable value of land and additions on the property. | Land | Improvement |
|---|---|---|---|---|
| 2024 | $3,651 | $53,615 | $9,266 | $44,349 |
| 2023 | $3,447 | $48,437 | $8,371 | $40,066 |
| 2022 | $3,309 | $44,166 | $7,633 | $36,533 |
| 2021 | $3,149 | $41,292 | $7,136 | $34,156 |
| 2020 | $2,906 | $37,866 | $6,812 | $31,054 |
| 2019 | $2,808 | $36,070 | $6,489 | $29,581 |
| 2018 | $2,435 | $30,629 | $6,113 | $24,516 |
| 2017 | $2,361 | $28,955 | $5,779 | $23,176 |
| 2016 | $2,225 | $26,862 | $5,361 | $21,501 |
| 2015 | -- | $24,622 | $4,914 | $19,708 |
| 2014 | -- | $24,318 | $4,853 | $19,465 |
| 2013 | -- | $28,484 | $4,981 | $23,503 |
Source: Public Records
Map
Nearby Homes
- 306 S Liberty St
- 270 Villa St
- 277 Gifford Place
- 262 Bartlett Place
- 528 E Chicago St
- 552 E Chicago St
- 364 Bent St
- 518 Raymond St
- 144 Hill Ave
- 764 Terrace Ct Unit A
- 628 S Liberty St
- 603 Wellington Ave
- 653 Park St
- 821 Bode Rd Unit 15
- 821 Bode Rd Unit 12
- 644 Lavoie Ave
- 650 Park St
- 645 Lavoie Ave
- 536 Aller Ave
- 453 Addison St
- 574 Barrett St
- 570 Barrett St
- 246 S Liberty St
- 242 S Liberty St
- 564 Barrett St Unit 66
- 551 Levine Ct Unit 53
- 560 Barrett St
- 300 S Liberty St
- 236 S Liberty St
- 550 Levine Ct Unit 52
- 571 Barrett St
- 554 Barrett St
- 567 Barrett St
- 232 S Liberty St
- 310 S Liberty St
- 563 Barrett St
- 529 Levine Ct Unit 31
- 600 Margaret Place
- 550 Barrett St
- 543 Stella Ct