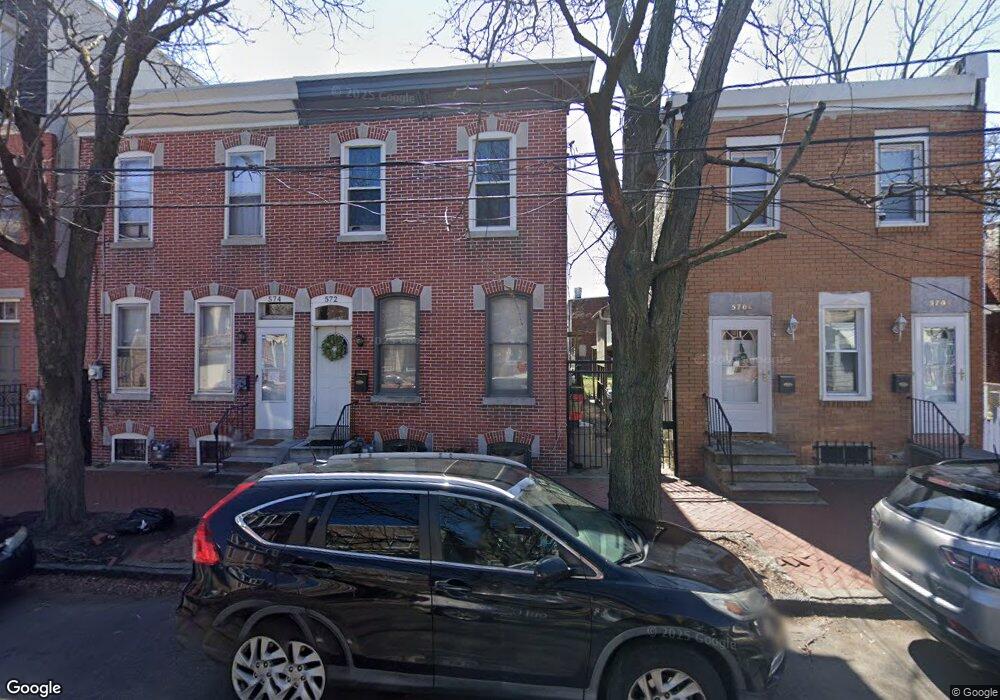
572 Berkley St Camden, NJ 08103
Lanning Square NeighborhoodEstimated Value: $144,149 - $289,000
--
Bed
--
Bath
1,774
Sq Ft
$136/Sq Ft
Est. Value
About This Home
This home is located at 572 Berkley St, Camden, NJ 08103 and is currently estimated at $241,537, approximately $136 per square foot. 572 Berkley St is a home located in Camden County with nearby schools including Camden High School, Hope Community Charter School, and Leap Academy University Charter School.
Ownership History
Date
Name
Owned For
Owner Type
Purchase Details
Closed on
Feb 28, 2014
Sold by
Ratleff Derrick
Bought by
Sanders Cassandra M
Current Estimated Value
Home Financials for this Owner
Home Financials are based on the most recent Mortgage that was taken out on this home.
Original Mortgage
$57,234
Outstanding Balance
$44,047
Interest Rate
4.75%
Mortgage Type
FHA
Estimated Equity
$197,490
Purchase Details
Closed on
Oct 17, 2003
Sold by
Waterman John
Bought by
Ratleff Derrick
Purchase Details
Closed on
Jun 14, 1996
Sold by
De Arijit
Bought by
Waterman John C
Home Financials for this Owner
Home Financials are based on the most recent Mortgage that was taken out on this home.
Original Mortgage
$76,000
Interest Rate
8.05%
Mortgage Type
FHA
Create a Home Valuation Report for This Property
The Home Valuation Report is an in-depth analysis detailing your home's value as well as a comparison with similar homes in the area
Home Values in the Area
Average Home Value in this Area
Purchase History
| Date | Buyer | Sale Price | Title Company |
|---|---|---|---|
| Sanders Cassandra M | $75,000 | None Available | |
| Ratleff Derrick | $73,500 | -- | |
| Waterman John C | $77,000 | -- |
Source: Public Records
Mortgage History
| Date | Status | Borrower | Loan Amount |
|---|---|---|---|
| Open | Sanders Cassandra M | $57,234 | |
| Previous Owner | Waterman John C | $76,000 |
Source: Public Records
Tax History Compared to Growth
Tax History
| Year | Tax Paid | Tax Assessment Tax Assessment Total Assessment is a certain percentage of the fair market value that is determined by local assessors to be the total taxable value of land and additions on the property. | Land | Improvement |
|---|---|---|---|---|
| 2025 | $2,285 | $64,500 | $8,500 | $56,000 |
| 2024 | $2,209 | $64,500 | $8,500 | $56,000 |
| 2023 | $2,209 | $64,500 | $8,500 | $56,000 |
| 2022 | $2,168 | $64,500 | $8,500 | $56,000 |
| 2021 | $2,160 | $64,500 | $8,500 | $56,000 |
| 2020 | $2,051 | $64,500 | $8,500 | $56,000 |
| 2019 | $1,964 | $64,500 | $8,500 | $56,000 |
| 2018 | $1,954 | $64,500 | $8,500 | $56,000 |
| 2017 | $1,906 | $64,500 | $8,500 | $56,000 |
| 2016 | $1,845 | $64,500 | $8,500 | $56,000 |
| 2015 | $1,776 | $64,500 | $8,500 | $56,000 |
| 2014 | $1,734 | $64,500 | $8,500 | $56,000 |
Source: Public Records
Map
Nearby Homes